
Compare Dreamfolks Servi with Similar Stocks
Dashboard
Poor long term growth as Operating profit has grown by an annual rate -143.64% of over the last 5 years
With a fall in PBT of -231.16%, the company declared Very Negative results in Mar 26
Risky - Negative Operating Profits
Consistent Underperformance against the benchmark over the last 3 years
Stock DNA
Transport Infrastructure
INR 356 Cr (Micro Cap)
31.00
34
0.00%
-0.44
3.68%
1.13
Total Returns (Price + Dividend) 
Latest dividend: 1.5 per share ex-dividend date: Sep-17-2024
Risk Adjusted Returns v/s
Returns Beta

News

Dreamfolks Services Ltd is Rated Strong Sell
Dreamfolks Services Ltd is rated Strong Sell by MarketsMOJO, with this rating last updated on 01 June 2026. However, the analysis and financial metrics discussed here reflect the company’s current position as of 10 June 2026, providing investors with the latest insights into its performance and outlook.
Read full news article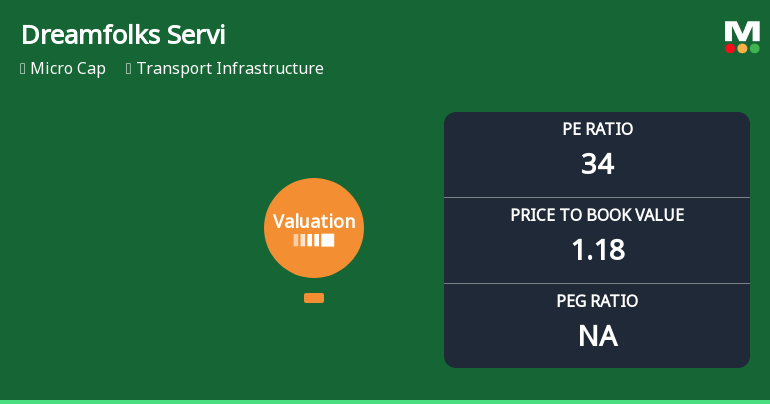
Dreamfolks Services Ltd Faces Valuation Reassessment Amidst Market Downturn
Dreamfolks Services Ltd, a micro-cap player in the transport infrastructure sector, has seen a marked deterioration in its valuation attractiveness, with key metrics such as the price-to-earnings (P/E) ratio and price-to-book value (P/BV) signalling increased risk. This shift comes amid a steep decline in stock price and underperformance relative to benchmark indices, prompting a downgrade to a Strong Sell rating.
Read full news article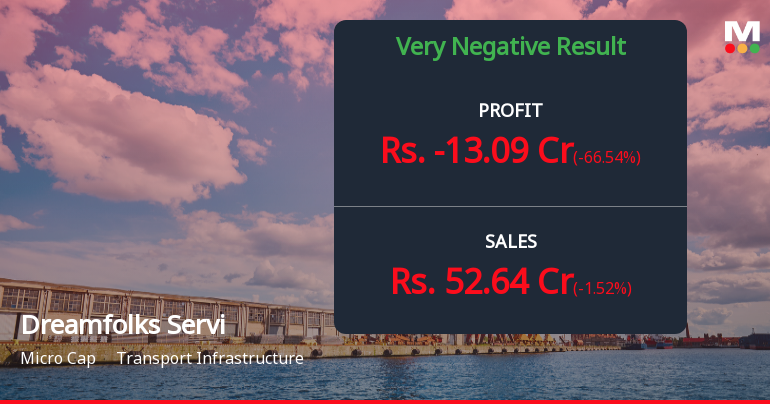
Dreamfolks Services Q4 FY26: Catastrophic Quarter Signals Deeper Structural Issues
Dreamfolks Services Ltd., the airport lounge aggregator, reported a shocking fourth quarter for FY26 that has sent alarm bells ringing across investor circles. The company posted a consolidated net loss of ₹13.09 crores for Q4 FY26, a dramatic reversal from the ₹14.94 crores profit recorded in the same quarter last year. This represents a staggering 187.62% year-on-year decline, marking the company's worst quarterly performance in recent history.
Read full news article Announcements
Announcement under Regulation 30 (LODR)-Newspaper Publication
04-Jun-2026 | Source : BSECopy of Newspaper publication w.r.t. Notice of Postal Ballot seeking approval of Members for Material Related Party Transaction(s) between Dreamfolks Services Limited and ETT Solutions DMCC is attached herewith
Shareholder Meeting / Postal Ballot-Notice of Postal Ballot
03-Jun-2026 | Source : BSENotice of Postal Ballot seeking approval of Members by way of Ordinary Resolution w.r.t. Approval of Related Party Transaction(s) between Dreamfolks Service Limited and ETT Solutions DMCC is attached herewith
Announcement under Regulation 30 (LODR)-Earnings Call Transcript
02-Jun-2026 | Source : BSETranscript of Earnings Conference Call held on May 29 2026 is attached herewith.
Corporate Actions

No Upcoming Board Meetings

Dreamfolks Services Ltd has declared 75% dividend, ex-date: 17 Sep 24

No Splits history available

No Bonus history available

No Rights history available
Quality key factors
Valuation key factors
Technicals key factors
 Technical Indicator Scale: Bearish, Mildly Bearish, Sideways, Mildly Bullish, Bullish Turned
 Shareholding Snapshot : Mar 2026
Shareholding Compare (%holding)
Promoters
None
Held by 0 Schemes
Held by 7 FIIs (0.6%)
Liberatha Peter Kallat (24.52%)
None
30.22%
Quarterly Results Snapshot (Consolidated) - Mar'26 - QoQ

QoQ Growth in quarter ended Mar 2026 is -1.52% vs -73.99% in Dec 2025
QoQ Growth in quarter ended Mar 2026 is -66.54% vs -169.99% in Dec 2025
Half Yearly Results Snapshot (Consolidated) - Sep'25

Growth in half year ended Sep 2025 is -13.05% vs 16.19% in Sep 2024
Growth in half year ended Sep 2025 is -2.34% vs 7.91% in Sep 2024
Nine Monthly Results Snapshot (Consolidated) - Dec'25
YoY Growth in nine months ended Dec 2025 is -37.82% vs 14.51% in Dec 2024
YoY Growth in nine months ended Dec 2025 is -51.18% vs -0.96% in Dec 2024
Annual Results Snapshot (Consolidated) - Mar'26
YoY Growth in year ended Mar 2026 is -48.87% vs 13.82% in Mar 2025
YoY Growth in year ended Mar 2026 is -82.33% vs -5.17% in Mar 2025
About Dreamfolks Services Ltd

Company Coordinates


