
Compare Duropack with Similar Stocks
Stock DNA
Plastic Products - Industrial
INR 30 Cr (Micro Cap)
16.00
21
0.00%
-0.08
8.27%
1.33
Total Returns (Price + Dividend) 
Duropack for the last several years.
Risk Adjusted Returns v/s
Returns Beta

News

Duropack Ltd is Rated Strong Sell
Duropack Ltd is rated Strong Sell by MarketsMOJO, with this rating last updated on 18 Aug 2025. However, the analysis and financial metrics discussed here reflect the stock’s current position as of 08 July 2026, providing investors with an up-to-date view of the company’s fundamentals, valuation, financial trends, and technical outlook.
Read full news article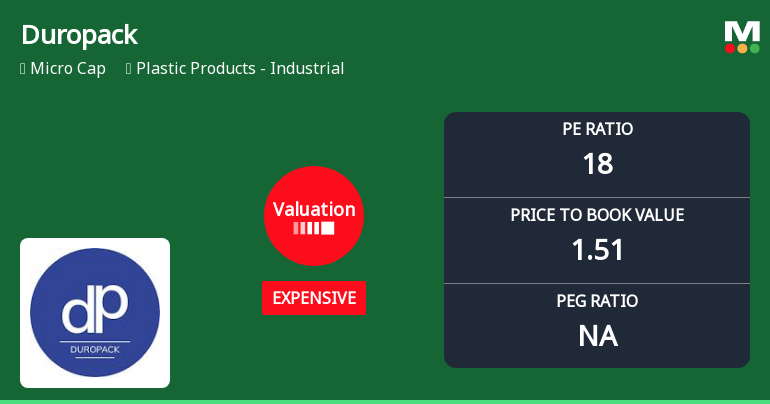
Duropack Ltd Valuation Shifts Signal Expensive Territory Amid Mixed Returns
Duropack Ltd, a micro-cap player in the Plastic Products - Industrial sector, has seen its valuation metrics shift notably towards an expensive classification, despite a mixed performance track record and a recent upgrade to a Strong Sell rating. This article analyses the evolving price attractiveness of Duropack in comparison to its peers and historical benchmarks, highlighting key valuation parameters and market returns.
Read full news article
Duropack Ltd is Rated Strong Sell
Duropack Ltd is rated Strong Sell by MarketsMOJO, with this rating last updated on 18 Aug 2025. However, the analysis and financial metrics discussed here reflect the stock’s current position as of 25 June 2026, providing investors with an up-to-date view of the company’s fundamentals, valuation, financial trend, and technical outlook.
Read full news article Announcements
Compliances-Certificate under Reg. 74 (5) of SEBI (DP) Regulations 2018
15-Jul-2026 | Source : BSECertificate under Regulation 74(5) of SEBI (Depositories and Participants) Regulations 2018 for quarter ended 30th June 2026
Announcement under Regulation 30 (LODR)-Newspaper Publication
30-May-2026 | Source : BSENewspaper Advertisement of Audited Financial Result for the quarter and year ended 31st March 2026.
Results-Financial Results For 31St March 2026
29-May-2026 | Source : BSETo consider and approve the audited Financial result for the quarter and year ended 31st March 2026.
Corporate Actions

No Upcoming Board Meetings

No Dividend history available

No Splits history available

No Bonus history available

No Rights history available
Quality key factors
Valuation key factors
Technicals key factors
 Technical Indicator Scale: Bearish, Mildly Bearish, Sideways, Mildly Bullish, Bullish Turned
 Shareholding Snapshot : Jun 2026
Shareholding Compare (%holding)
Promoters
None
Held by 0 Schemes
Held by 0 FIIs
Vivek Jain (17.96%)
Amit Krishnakant Desai (3.03%)
28.06%
Quarterly Results Snapshot (Standalone) - Mar'26 - QoQ

QoQ Growth in quarter ended Mar 2026 is 1.25% vs -1.32% in Dec 2025
QoQ Growth in quarter ended Mar 2026 is 6.52% vs -8.00% in Dec 2025
Half Yearly Results Snapshot (Standalone) - Sep'25
Growth in half year ended Sep 2025 is 24.83% vs -3.58% in Sep 2024

Growth in half year ended Sep 2025 is -45.78% vs 32.80% in Sep 2024
Nine Monthly Results Snapshot (Standalone) - Dec'25
YoY Growth in nine months ended Dec 2025 is 23.43% vs -1.08% in Dec 2024
YoY Growth in nine months ended Dec 2025 is -39.01% vs 15.54% in Dec 2024
Annual Results Snapshot (Standalone) - Mar'26
YoY Growth in year ended Mar 2026 is 21.41% vs 3.66% in Mar 2025
YoY Growth in year ended Mar 2026 is -22.92% vs 11.11% in Mar 2025
About Duropack Ltd

Company Coordinates


