
Compare Duropack with Similar Stocks
Stock DNA
Plastic Products - Industrial
INR 30 Cr (Micro Cap)
16.00
18
0.00%
-0.08
8.27%
1.32
Total Returns (Price + Dividend) 
Duropack for the last several years.
Risk Adjusted Returns v/s
Returns Beta

News
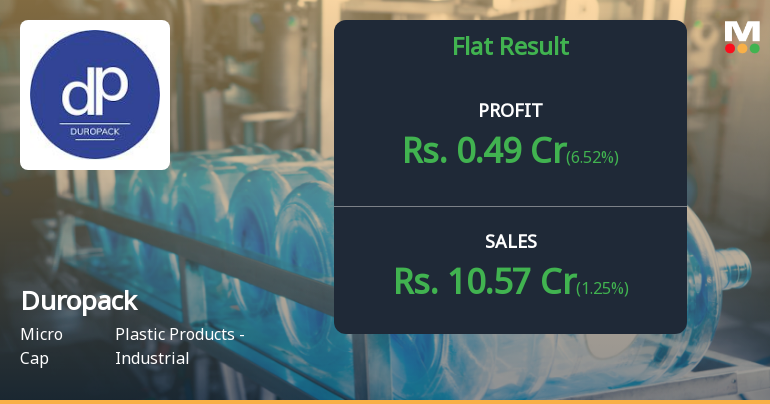
Duropack Ltd Q4 FY26: Modest Growth Masks Margin Pressure and Valuation Concerns
Duropack Limited, a micro-cap manufacturer of plastic films and packaging solutions, reported a mixed performance for the quarter ended March 2026 (Q4 FY26), with net profit rising 188.24% year-on-year to ₹0.49 crores from ₹0.17 crores in Q4 FY25. However, the sequential performance revealed a more nuanced picture, with profits rising just 6.52% quarter-on-quarter from ₹0.46 crores in Q3 FY26. The company's shares have declined sharply by 34.61% over the past year, significantly underperforming the Sensex's 8.40% decline, reflecting investor concerns about sustainability of margins and competitive positioning in the industrial plastics sector.
Read full news article
Duropack Ltd is Rated Strong Sell
Duropack Ltd is rated Strong Sell by MarketsMOJO, with this rating last updated on 18 Aug 2025. However, the analysis and financial metrics discussed below reflect the stock’s current position as of 14 May 2026, providing investors with an up-to-date view of the company’s fundamentals, returns, and market performance.
Read full news article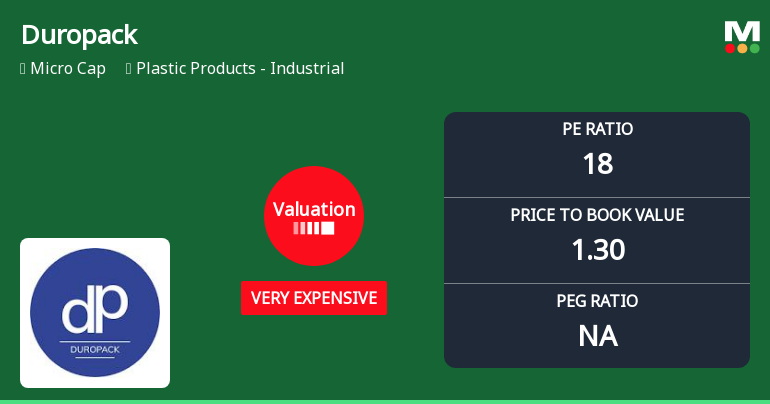
Duropack Ltd Valuation Shifts Signal Elevated Price Risk Amid Mixed Returns
Duropack Ltd, a micro-cap player in the Plastic Products - Industrial sector, has seen a marked shift in its valuation parameters, moving from fair to very expensive territory. This change, coupled with a recent upgrade in its Mojo Grade to Strong Sell, highlights growing concerns over price attractiveness despite a recent 5.03% intraday gain. A detailed analysis of its price-to-earnings (P/E), price-to-book value (P/BV), and other key metrics against historical averages and peer benchmarks reveals the challenges investors face in assessing the stock’s true value.
Read full news article Announcements
Announcement under Regulation 30 (LODR)-Newspaper Publication
30-May-2026 | Source : BSENewspaper Advertisement of Audited Financial Result for the quarter and year ended 31st March 2026.
Results-Financial Results For 31St March 2026
29-May-2026 | Source : BSETo consider and approve the audited Financial result for the quarter and year ended 31st March 2026.
Certificate from CEO/CFO
29-May-2026 | Source : BSECertificate by CEO/CFO under regulation 33(2) of SEBI(LODR)Regulation
Corporate Actions

No Upcoming Board Meetings

No Dividend history available

No Splits history available

No Bonus history available

No Rights history available
Quality key factors
Valuation key factors
Technicals key factors
 Technical Indicator Scale: Bearish, Mildly Bearish, Sideways, Mildly Bullish, Bullish Turned
 Shareholding Snapshot : Mar 2026
Shareholding Compare (%holding)
Promoters
None
Held by 0 Schemes
Held by 0 FIIs
Vivek Jain (17.96%)
Amit Krishnakant Desai (3.03%)
28.06%
Quarterly Results Snapshot (Standalone) - Mar'26 - QoQ

QoQ Growth in quarter ended Mar 2026 is 1.25% vs -1.32% in Dec 2025
QoQ Growth in quarter ended Mar 2026 is 6.52% vs -8.00% in Dec 2025
Half Yearly Results Snapshot (Standalone) - Sep'25
Growth in half year ended Sep 2025 is 24.83% vs -3.58% in Sep 2024

Growth in half year ended Sep 2025 is -45.78% vs 32.80% in Sep 2024
Nine Monthly Results Snapshot (Standalone) - Dec'25
YoY Growth in nine months ended Dec 2025 is 23.43% vs -1.08% in Dec 2024
YoY Growth in nine months ended Dec 2025 is -39.01% vs 15.54% in Dec 2024
Annual Results Snapshot (Standalone) - Mar'26
YoY Growth in year ended Mar 2026 is 21.41% vs 3.66% in Mar 2025
YoY Growth in year ended Mar 2026 is -22.92% vs 11.11% in Mar 2025
About Duropack Ltd

Company Coordinates


