
Compare Duroply Indust. with Similar Stocks
Stock DNA
Plywood Boards/ Laminates
INR 132 Cr (Micro Cap)
42.00
54
0.00%
0.44
2.11%
0.88
Total Returns (Price + Dividend) 
Duroply Indust. for the last several years.
Risk Adjusted Returns v/s
Returns Beta

News
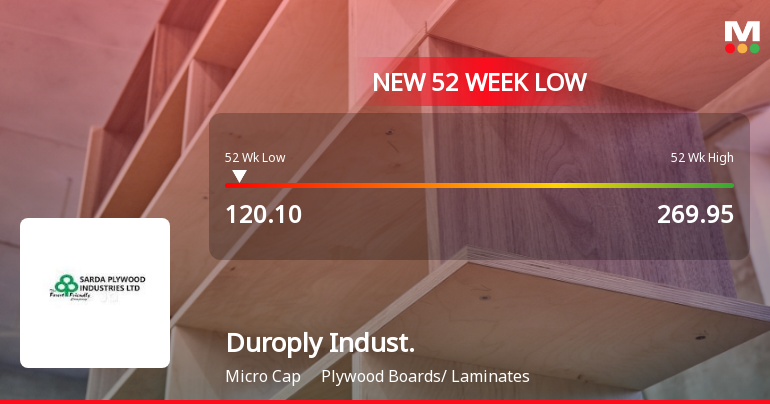
Duroply Industries Ltd Falls to 52-Week Low of Rs 120.1 as Sell-Off Deepens
For the second consecutive session, Duroply Industries Ltd has seen its share price decline, culminating in a fresh 52-week low of Rs 120.1 on 29 Jun 2026. This marks a significant 55.5% drop from its 52-week high of Rs 269.95, underscoring persistent selling pressure despite a broadly resilient market backdrop.
Read full news article
Duroply Industries Ltd is Rated Strong Sell
Duroply Industries Ltd is rated Strong Sell by MarketsMOJO, with this rating last updated on 12 May 2026. However, the analysis and financial metrics presented here reflect the stock’s current position as of 26 June 2026, providing investors with the most recent and relevant data to assess the company’s outlook.
Read full news article
Duroply Industries Ltd is Rated Strong Sell
Duroply Industries Ltd is rated Strong Sell by MarketsMOJO. This rating was last updated on 12 May 2026, reflecting a significant reassessment of the stock’s outlook. However, all fundamentals, returns, and financial metrics discussed below are current as of 15 June 2026, providing investors with the latest perspective on the company’s position.
Read full news article Announcements
Closure of Trading Window
25-Jun-2026 | Source : BSEClosure of Trading window
Announcement under Regulation 30 (LODR)-Resignation of Chief Financial Officer (CFO)
10-Jun-2026 | Source : BSEResignation of CFO
Announcement under Regulation 30 (LODR)-Earnings Call Transcript
27-May-2026 | Source : BSEPlease find enclosed transcript of the Earnings Webinar held on Monday 25th May 2026 post declaration of Audited Financial Results for the quarter and financial year ended 31st March 2026.
Corporate Actions

No Upcoming Board Meetings

Duroply Industries Ltd has declared 10% dividend, ex-date: 13 Sep 06

No Splits history available

No Bonus history available

No Rights history available
Quality key factors
Valuation key factors
Technicals key factors
 Technical Indicator Scale: Bearish, Mildly Bearish, Sideways, Mildly Bullish, Bullish Turned
 Shareholding Snapshot : Mar 2026
Shareholding Compare (%holding)
Promoters
6.7113
Held by 2 Schemes (0.08%)
Held by 0 FIIs
Poushali Sales Private Limited (11.24%)
Tusk Investments (6.41%)
27.95%
Quarterly Results Snapshot (Standalone) - Mar'26 - QoQ

QoQ Growth in quarter ended Mar 2026 is 19.91% vs -10.94% in Dec 2025

QoQ Growth in quarter ended Mar 2026 is -271.33% vs -40.66% in Dec 2025
Half Yearly Results Snapshot (Standalone) - Sep'25
Growth in half year ended Sep 2025 is 12.76% vs 10.35% in Sep 2024
Growth in half year ended Sep 2025 is 3.66% vs 97.93% in Sep 2024
Nine Monthly Results Snapshot (Standalone) - Dec'25
YoY Growth in nine months ended Dec 2025 is 9.66% vs 11.08% in Dec 2024
YoY Growth in nine months ended Dec 2025 is 6.94% vs 125.00% in Dec 2024
Annual Results Snapshot (Standalone) - Mar'26
YoY Growth in year ended Mar 2026 is 8.31% vs 14.96% in Mar 2025
YoY Growth in year ended Mar 2026 is -62.16% vs 669.31% in Mar 2025
About Duroply Industries Ltd

Company Coordinates


