
Compare Dynamatic Tech. with Similar Stocks
Dashboard
Weak Long Term Fundamental Strength with an average Return on Capital Employed (ROCE) of 8.30%
- Poor long term growth as Net Sales has grown by an annual rate of 6.69% and Operating profit at 11.62% over the last 5 years
- Low ability to service debt as the company has a high Debt to EBITDA ratio of 3.49 times
With ROCE of 7.8, it has a Very Expensive valuation with a 5.5 Enterprise value to Capital Employed
Stock DNA
Industrial Manufacturing
INR 7,166 Cr (Small Cap)
140.00
43
0.05%
0.72
6.30%
8.85
Total Returns (Price + Dividend) 
Latest dividend: 5 per share ex-dividend date: Feb-13-2026
Risk Adjusted Returns v/s
Returns Beta

News

Dynamatic Technologies Ltd is Rated Sell
Dynamatic Technologies Ltd is rated 'Sell' by MarketsMOJO, with this rating last updated on 23 June 2026. However, the analysis and financial metrics presented here reflect the stock's current position as of 27 July 2026, providing investors with the latest insights into the company’s performance and outlook.
Read full news article
Dynamatic Technologies Ltd is Rated Sell
Dynamatic Technologies Ltd is rated Sell by MarketsMOJO, with this rating last updated on 23 June 2026. However, the analysis and financial metrics discussed here reflect the stock's current position as of 16 July 2026, providing investors with an up-to-date view of the company’s fundamentals, valuation, financial trends, and technical outlook.
Read full news article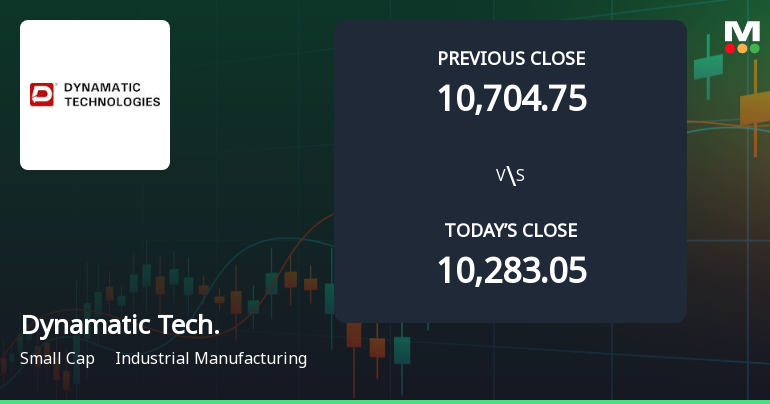
Announcements
Compliances-Certificate under Reg. 74 (5) of SEBI (DP) Regulations 2018
15-Jul-2026 | Source : BSECertificate under Reg. 74 (5) of SEBI (DP) Regulations 2018
Closure of Trading Window
26-Jun-2026 | Source : BSETrading Window Closure
Announcement under Regulation 30 (LODR)-Newspaper Publication
28-May-2026 | Source : BSECopy of Newspaper Publication regarding special window for transfer and dematerialization of physical shares
Corporate Actions

No Upcoming Board Meetings

Dynamatic Technologies Ltd has declared 50% dividend, ex-date: 28 Aug 26

No Splits history available

No Bonus history available

No Rights history available
Quality key factors
Valuation key factors
Technicals key factors
 Technical Indicator Scale: Bearish, Mildly Bearish, Sideways, Mildly Bullish, Bullish Turned
 Shareholding Snapshot : Jun 2026
Shareholding Compare (%holding)
Promoters
None
Held by 11 Schemes (8.31%)
Held by 51 FIIs (10.26%)
Jkm Holdings Private Limited (16.38%)
Hdfc Trustee Company Limited - Hdfc Infrastructure (5.32%)
23.13%
Quarterly Results Snapshot (Consolidated) - Mar'26 - QoQ

QoQ Growth in quarter ended Mar 2026 is 1.95% vs 8.28% in Dec 2025

QoQ Growth in quarter ended Mar 2026 is 117.68% vs 74.32% in Dec 2025
Half Yearly Results Snapshot (Consolidated) - Sep'25
Growth in half year ended Sep 2025 is 7.86% vs -0.80% in Sep 2024
Growth in half year ended Sep 2025 is -39.88% vs -56.19% in Sep 2024
Nine Monthly Results Snapshot (Consolidated) - Dec'25
YoY Growth in nine months ended Dec 2025 is 16.13% vs -3.38% in Dec 2024
YoY Growth in nine months ended Dec 2025 is -26.35% vs -58.35% in Dec 2024
Annual Results Snapshot (Consolidated) - Mar'26
YoY Growth in year ended Mar 2026 is 15.50% vs -1.79% in Mar 2025
YoY Growth in year ended Mar 2026 is -24.70% vs -64.67% in Mar 2025
About Dynamatic Technologies Ltd

Company Coordinates


