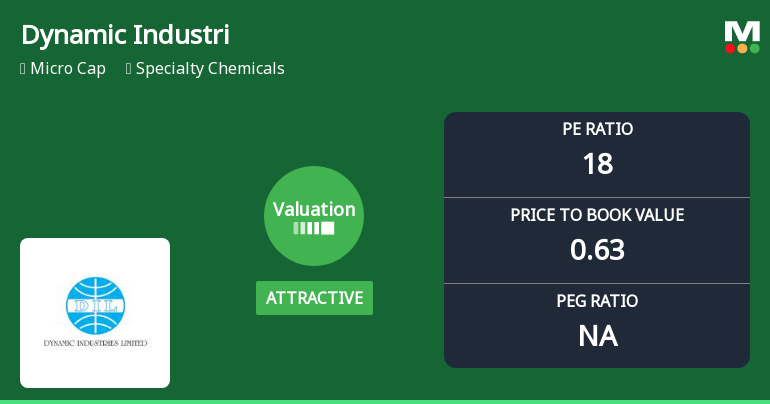
Dynamic Industri

  • Market Cap: Micro Cap
  • Industry: Specialty Chemicals
  • ISIN: INE457C01010
  • NSEID:
  • BSEID: 524818
INR
99.30
-4.65 (-4.47%)
BSENSE

Sep 01, 03:30 PM

BSE+NSE Vol: 5.43 k

  • Price Points
  • Score
  • Mojo Parameters
  • Total Return
  • News and Corporate Actions
  • Key factors
  • Shareholding
  • Financials
  • CompanyCV
stock-summaryPrice Point
High/Low

1Day

52 Week

Valuation
Technical
Day's Volume

CASH

5.43 k (66.60%) Volume

Shareholding (Jun 2026)

FII

0.00%

Held by 0 FIIs

DII

0.00%

Held by 0 DIIs

Promoter

41.40%

Why is Dynamic Industries Ltd falling/rising?

02-Sep-2026

As of 01-Sep, Dynamic Industries Ltd's stock price is declining, currently at 99.30, down 4.47%. This decline is due to significant underperformance compared to the Sensex, weak investor interest, and unfavorable fundamental indicators.

As of 01-Sep, Dynamic Industries Ltd is experiencing a decline in its stock price, currently at 99.30, which reflects a change of -4.65 (-4.47%). This downward trend can be attributed to several factors highlighted in the provided data. <BR><BR>Firstly, the stock has underperformed significantly compared to the benchmark Sensex, with a 1-week decline of -3.59% against the Sensex's -0.92%. Over the past month, the stock has dropped by -9.60%, while the Sensex has only decreased by -1.47%. Year-to-date, the stock's performance is even more concerning, showing a decline of -17.52% compared to the Sensex's -9.71%. <BR><BR>Additionally, the stock has been on a consecutive fall for the last two days, with a total decline of -6.68% during this period. On the trading day in question, it reached an intraday low of Rs 98.55, marking a decrease of -5.19%. The trading volume has also indicated a lack of investor interest, with delivery volume dropping by -94.79% against the 5-day average, suggesting a significant reduction in participation.<BR><BR>Moreover, the stock is trading below its moving averages across various time frames, including the 5-day, 20-day, 50-day, 100-day, and 200-day averages, which typically signals bearish sentiment among investors. The company's fundamentals are also weak, with a low Return on Equity (ROE) of 2.52% and a poor EBIT to Interest ratio of 1.48, indicating challenges in servicing debt and long-term growth potential.<BR><BR>In summary, the combination of poor recent performance, weak investor participation, and unfavorable fundamental indicators has contributed to the decline in Dynamic Industries Ltd's stock price.

View full answer

Who are in the management team of Dynamic Industri?

01-Sep-2026

The management team of Dynamic Industri includes Harin D Mamlatdarna (Chairman & Executive Director), Neeraj Shah (Managing Director), Apurva Modi (Whole-Time Director), and three Independent Non-Executive Directors: Jatin B Surti, Pravinchandra D Master, and Viraj Darshit Shah.

The management team of Dynamic Industri includes the following individuals:<BR><BR>1. **Harin D Mamlatdarna** - Chairman & Executive Director<BR>2. **Neeraj Shah** - Executive Director, Managing Director, and Promoter<BR>3. **Apurva Modi** - Whole-Time Director & Executive Director<BR>4. **Jatin B Surti** - Independent Non-Executive Director<BR>5. **Pravinchandra D Master** - Independent Non-Executive Director<BR>6. **Viraj Darshit Shah** - Independent Non-Executive Director<BR><BR>If you need more information about any specific member or their roles, feel free to ask!

View full answer

What does Dynamic Industri do?

01-Sep-2026

Dynamic Industries Ltd manufactures specialty chemicals, primarily dyes, and operates in the micro cap market. As of June 2026, it reported net sales of 22 Cr and a net profit of 1 Cr, with a market cap of INR 32 Cr.

Overview:<BR>Dynamic Industries Ltd is engaged in the manufacturing of specialty chemicals, primarily focusing on dyes and dye stuffs, and operates within the micro cap market segment.<BR><BR>History:<BR>Dynamic Industries Limited was incorporated in 1988 and transitioned to a Private Limited Company in 1989 with an initial staff of 10. The company began producing reactive dyes and expanded its product line to include non benzydene direct dyes in 1991. The latest reported quarterly results indicate net sales and profit for June 2026.<BR><BR>Financial Snapshot:<BR>- Net Sales: 22 Cr (Quarterly Results - Jun 2026)<BR>- Net Profit: 1 Cr (Quarterly Results - Jun 2026)<BR>- Market Cap: INR 32 Cr (Micro Cap)<BR><BR>Key Metrics:<BR>- P/E: 18.00<BR>- Industry P/E: 18<BR>- Dividend Yield: 0.00%<BR>- Debt Equity: 0.27<BR>- Return on Equity: 3.55%<BR>- Price to Book: 0.64<BR><BR>Contact Details:<BR>Address: Plot No 5501/2 Phase III GIDC, Nr Trikampura Cross Rds Vatva Ahmedabad Gujarat : 382445<BR>Tel: 91-079-25897221/22/23<BR>Email: invgrv@dynaind.com/admin@dynaind.co<BR>Website: http://www.dynaind.com

View full answer

Who are the peers of the Dynamic Industri?

01-Sep-2026

Dynamic Industri's peers include Kemistar Corp., Bhatia Colour, Crestchem, Yug Decor, Seya Industries, Daikaffil Chem, Machhar Industri, Vikram Aroma, and AMS Polymers. Crestchem shows the best management and growth metrics, while Bhatia Colour has the lowest 1-year return at -90.79%, with Dynamic Industri at -4.72%.

Peers: The peers of Dynamic Industri are Kemistar Corp., Bhatia Colour, Crestchem, Yug Decor, Seya Industries, Daikaffil Chem, Machhar Industri, Vikram Aroma, and AMS Polymers.<BR><BR>Quality Snapshot: Excellent management risk is observed at Crestchem, while Average management risk is found at Kemistar Corp., Yug Decor, and Dynamic Industri, and the rest. Below Average management risk is noted for Bhatia Colour, Seya Industries, Daikaffil Chem, Machhar Industri, Vikram Aroma, and AMS Polymers. Growth is rated as Good for Crestchem and AMS Polymers, while Average growth is seen at Kemistar Corp. and Yug Decor, and the rest experience Below Average growth. Capital Structure is Excellent for AMS Polymers, Good for Bhatia Colour and Machhar Industri, Average for Vikram Aroma, and Below Average for Kemistar Corp., Crestchem, Yug Decor, Seya Industries, Dynamic Industri, and Daikaffil Chem.<BR><BR>Return Snapshot: The peer with the highest 1-year return is Crestchem at 6.10%, while Bhatia Colour has the lowest at -90.79%. Dynamic Industri's 1-year return of -4.72% is better than Bhatia Colour's but worse than Crestchem's. Additionally, peers with negative six-month returns include Bhatia Colour, Seya Industries, and AMS Polymers.

View full answer

How big is Dynamic Industri?

01-Sep-2026

As of 31st August, Dynamic Industries Ltd has a market capitalization of 32.00 Cr, with recent net sales of 70.83 Cr and a net profit of 1.77 Cr. The latest balance sheet shows shareholder's funds of 41.36 Cr and total assets of 63.09 Cr.

As of 31st August, Dynamic Industries Ltd has a market capitalization of 32.00 Cr, which classifies it as a Micro Cap company.<BR><BR>In the latest four quarters, Dynamic Industries reported Net Sales of 70.83 Cr and a Net Profit of 1.77 Cr.<BR><BR>The latest annual period for the balance sheet is March 2018, with Shareholder's Funds amounting to 41.36 Cr and Total Assets of 63.09 Cr.

View full answer

Should I buy, sell or hold Dynamic Industries Ltd?

25-Aug-2026

Are Dynamic Industries Ltd latest results good or bad?

29-May-2026

Dynamic Industries Ltd's latest results show strong quarter-on-quarter improvements in net sales and profit, but year-on-year sales have declined, and the return on equity remains low. Overall, while there are positive signs, the persistent revenue decline and weak performance relative to the market suggest the results are not particularly strong.

Dynamic Industries Ltd's latest results present a mixed picture. On one hand, the company has shown significant improvement in certain financial metrics for Q4 FY26. Net sales increased by 22.91% quarter-on-quarter to ₹17.33 crores, and net profit surged by an impressive 1,140% quarter-on-quarter to ₹0.62 crores. Additionally, operating margins improved to 7.85%, up from 6.24% in the previous quarter, indicating better cost management.<BR><BR>However, there are notable concerns. Year-on-year, net sales declined by 8.69%, highlighting ongoing demand volatility in the sector. The company's return on equity (ROE) remains low at 2.49%, suggesting inefficiencies in generating shareholder value. The stock has also underperformed the broader market, declining 12.51% over the past year compared to the Sensex's 6.91% drop.<BR><BR>In summary, while there are positive signs of recovery and margin expansion, the persistent revenue decline and weak return ratios indicate that the overall results may not be considered strong. Investors should weigh these factors carefully when assessing the company's performance.

View full answer

When is the next results date for Dynamic Industries Ltd?

21-May-2026

The next results date for Dynamic Industries Ltd is 27 May 2026.

The next results date for Dynamic Industries Ltd is scheduled for 27 May 2026.

View full answer

How has been the historical performance of Dynamic Industri?

17-Nov-2025

Dynamic Industri's historical performance shows declining net sales and total operating income from 2014 to 2018, alongside reduced total assets and liabilities. Despite these challenges, the company maintained profitability, with profit before tax and earnings per share increasing during the same period.

Answer:<BR>The historical performance of Dynamic Industri shows a fluctuating trend in key financial metrics over the years.<BR><BR>Breakdown:<BR>Dynamic Industri's net sales peaked at 104.13 Cr in Mar'14 but have generally declined since, reaching 58.53 Cr in Mar'18. Total operating income followed a similar trend, decreasing from 104.58 Cr in Mar'14 to 58.53 Cr in Mar'18. The company's total expenditure, excluding depreciation, also decreased from 96.72 Cr in Mar'14 to 53.20 Cr in Mar'18. Operating profit (PBDIT) saw a decline from 8.04 Cr in Mar'14 to 5.88 Cr in Mar'18, while profit before tax increased from 5.78 Cr in Mar'14 to 4.35 Cr in Mar'18, indicating improved profitability despite lower sales. Profit after tax rose from 3.99 Cr in Mar'14 to 3.05 Cr in Mar'18, with earnings per share increasing from 13.18 to 10.07 over the same period. The company's total assets decreased from 86.69 Cr in Mar'14 to 63.09 Cr in Mar'18, while total liabilities also fell from 86.69 Cr to 63.09 Cr, reflecting a reduction in debt levels. Cash flow from operating activities turned negative in Mar'18 at -1.07 Cr, contrasting with positive cash flows in previous years. Overall, while Dynamic Industri has faced challenges in sales and operating performance, it has managed to maintain profitability and reduce liabilities.

View full answer

Is Dynamic Industri overvalued or undervalued?

19-Sep-2025

As of September 18, 2025, Dynamic Industri is considered fairly valued with a PE ratio of 21.72 and strong growth potential, outperforming the Sensex with a 1-year return of 30.68%, while its peers show mixed valuations.

As of 18 September 2025, the valuation grade for Dynamic Industri has moved from very attractive to attractive. The company is currently considered fairly valued. Key ratios include a PE ratio of 21.72, an EV to EBITDA ratio of 10.14, and a PEG ratio of 0.05, indicating strong growth potential relative to its price.<BR><BR>In comparison to peers, Sudarshan Chem is deemed expensive with a PE ratio of 164.31, while Ultramarine Pig. is attractive with a PE ratio of 17.57. Dynamic Industri's valuation metrics suggest it is positioned competitively within the specialty chemicals sector. Additionally, the company's stock has significantly outperformed the Sensex, with a 1-year return of 30.68% compared to the Sensex's 0.08%, reinforcing its favorable valuation outlook.

View full answer

What is the technical trend for Dynamic Industri?

09-Jun-2025

As of June 4, 2025, Dynamic Industries shows a bullish technical trend supported by a bullish MACD and moving averages, despite a bearish weekly RSI indicating some short-term weakness.

As of 4 June 2025, the technical trend for Dynamic Industri has changed from mildly bullish to bullish. The weekly MACD is bullish, supporting the upward momentum, while the daily moving averages also indicate a bullish stance. However, the weekly RSI is bearish, suggesting some short-term weakness. The Bollinger Bands show a mildly bullish trend on both weekly and monthly time frames, and the KST is bullish on both weekly and monthly as well. Dow Theory indicates a mildly bullish stance on the weekly but no trend on the monthly. Overall, the current technical stance is bullish, driven primarily by the bullish MACD and moving averages, despite some mixed signals from the RSI.

View full answer

Who are the top shareholders of the Dynamic Industri?

06-Jun-2025

The top shareholders of Dynamic Industri are Apurva Kamleshbhai Mod with 25.94%, Neeraj Shah with 11.16%, and individual investors holding 52.05%. There are no mutual funds or foreign institutional investors involved, and no pledged promoter holdings.

The top shareholders of Dynamic Industri include Apurva Kamleshbhai Mod, who holds the highest promoter stake at 25.94%. The highest public shareholder is Neeraj Shah, with a holding of 11.16%. Additionally, individual investors collectively hold 52.05% of the company's shares. There are no mutual funds or foreign institutional investors currently holding shares in the company, and there are no pledged promoter holdings.

View full answer

Has Dynamic Industri declared dividend?

06-Jun-2025

Dynamic Industries Ltd has declared a 5% dividend, amounting to $0.50 per share, with an ex-date of September 2, 2024. The company has shown strong total returns across various periods, with a total return of 168.48% over the past five years.

Dynamic Industries Ltd has declared a 5% dividend.<BR><BR>Dividend Details:<BR>- Percentage announced: 5%<BR>- Amount per share: 0.5<BR>- Ex-date: 02 Sep 2024<BR><BR>Dividend Yield: 0.42%.<BR><BR>Total Returns by Period:<BR>In the 6-month period, the price return was 3.46%, the dividend return was 0%, resulting in a total return of 3.46%.<BR><BR>For the 1-year period, the price return was 58.18%, the dividend return was 0.72%, leading to a total return of 58.9%.<BR><BR>Over the 2-year period, the price return was 86.39%, the dividend return was 2.45%, culminating in a total return of 88.84%.<BR><BR>In the 3-year period, the price return was 47.85%, the dividend return was 3.71%, resulting in a total return of 51.56%.<BR><BR>For the 4-year period, the price return was 66.59%, the dividend return was 4.93%, leading to a total return of 71.52%.<BR><BR>In the 5-year period, the price return was 156.95%, the dividend return was 11.53%, culminating in a total return of 168.48%.<BR><BR>Overall, Dynamic Industries Ltd has declared a dividend while also showing significant total returns across various periods, indicating a strong performance in both price appreciation and dividend distribution.

View full answer
iScoreScore
Click here to find our call on this stock
Strong Sell
Sell
Hold
Buy
Strong Buy

Dashboard

1

Weak Long Term Fundamental Strength with an average Return on Equity (ROE) of 2.52%

  • Poor long term growth as Net Sales has grown by an annual rate of 10.57% over the last 5 years
  • Company's ability to service its debt is weak with a poor EBIT to Interest (avg) ratio of 1.48
2

Flat results in Jun 26

 
3

Underperformed the market in the last 1 year

stock-summaryMojo Parameters

Mojo Parameters

Loading Valuation Snapshot...

Stock DNA

stock-summary
Industry

Specialty Chemicals

stock-summary
Market cap

INR 32 Cr (Micro Cap)

stock-summary
P/E

17.00

stock-summary
Industry P/E

18

stock-summary
Dividend Yield

0.00%

stock-summary
Debt Equity

0.27

stock-summary
Return on Equity

3.55%

stock-summary
Price to Book

0.63

Revenue and Profits:
Net Sales:
22 Cr
(Quarterly Results - Jun 2026)
Net Profit:
1 Cr
stock-summaryTotal Returns
Total Returns (Price + Dividend) stock-summary
Dividend Yield (0%)
TimePeriod
Price Return
Dividend Return
Total Return
3 Months
-8.44%
0.90%
-7.54%
6 Months
3.87%
1.06%
4.93%
1 Year
-13.16%
0.92%
-12.24%
2 Years
11.04%
1.95%
12.99%
3 Years
57.79%
3.98%
61.77%
4 Years
24.12%
4.50%
28.62%
5 Years
25.38%
5.41%
30.79%

Latest dividend: 1 per share ex-dividend date: Aug-22-2025

Risk Adjusted Returns v/s stock-summary
Returns Beta
Icon
Beta has not been calculated since enough price history is not available
stock-summaryNews & Corporate Actions

Announcements stock-summary

Submission Of Newspaper Advertisement Under Reguation 30 Of SEBI LODR

29-Aug-2026 | Source : BSE

Please find newspaper advertisement inrespect of information regarding 37th AGM of the company.

Notice Of 37Th Annual General Meeting Of The Company For The F.Y. 2025-2026 .

27-Aug-2026 | Source : BSE

Please find attache Notice of Annual General Meeting of the company for the f.y. 2025-2026.

37Th Annual General Meeting Record Date E-Voting Facility To The Shareholders And Book Closure.

27-Aug-2026 | Source : BSE

The record date for the purpose of dividend and evoting is 14th september 2026

Corporate Actions stock-summary

stock-summary
BOARD MEETING

No Upcoming Board Meetings

stock-summary
DIVIDEND

Dynamic Industries Ltd has declared 10% dividend, ex-date: 11 Sep 26

stock-summary
SPLITS

No Splits history available

stock-summary
BONUS

No Bonus history available

stock-summary
RIGHTS

No Rights history available

stock-summaryKey Factors

Quality key factors stock-summary

Factor
Value
Sales Growth (5y)
10.57%
EBIT Growth (5y)
27.20%
EBIT to Interest (avg)
1.48
Debt to EBITDA (avg)
4.03
Net Debt to Equity (avg)
0.27
Sales to Capital Employed (avg)
1.07
Tax Ratio
35.29%
Dividend Payout Ratio
19.10%
Pledged Shares
0
Institutional Holding
0
ROCE (avg)
5.24%
ROE (avg)
2.52%

Valuation key factors

Factor
Value
P/E Ratio
17
Industry P/E
18
Price to Book Value
0.60
EV to EBIT
13.93
EV to EBITDA
8.25
EV to Capital Employed
0.68
EV to Sales
0.61
PEG Ratio
NA
Dividend Yield
NA
ROCE (Latest)
5.14%
ROE (Latest)
3.55%

Technicals key factors

Indicator
Weekly
Monthly
MACD
Bearish
Mildly Bearish
RSI
No Signal
No Signal
Bollinger Bands
Bearish
Bearish
Moving Averages
Bearish (Daily)
KST
Mildly Bearish
Mildly Bearish
Dow Theory
Mildly Bearish
Mildly Bearish
stock-summary Technical Indicator Scale: Bearish, Mildly Bearish, Sideways, Mildly Bullish, Bullish  Turned 
stock-summaryShareholding
Shareholding Snapshot : Jun 2026stock-summary
Shareholding Compare (%holding) stock-summary
Majority shareholders

Non Institution

Pledged Promoter Holdings

None

Mutual Funds

Held by 0 Schemes

FIIs

Held by 0 FIIs

Promoter with highest holding

Apurva Kamleshbhai Modi (25.94%)

Highest Public shareholder

Neeraj Shah (11.52%)

Individual Investors Holdings

51.39%

stock-summaryFinancial
[
  {
    "link": "quarterly",
    "btn_text": "All Quarterly Results",
    "header": "Quarterly Results Snapshot (Standalone) - Jun'26 - QoQ",
    "rhs": [
      {
        "prefix": "Net Sales ",
        "suffix": "QoQ Growth in quarter ended Jun 2026 is 24.18% vs 22.91% in Mar 2026",
        "dir": 1
      },
      {
        "prefix": "Standalone Net Profit ",
        "suffix": "QoQ Growth in quarter ended Jun 2026 is 19.35% vs 1,140.00% in Mar 2026",
        "dir": -1
      }
    ],
    "table": {
      "header": [
        "Jun'26",
        "Mar'26",
        "Change(%)"
      ],
      "body": [
        {
          "field": "Net Sales",
          "val1": "21.52",
          "val2": "17.33",
          "chgp": "24.18%",
          "chgp_class": "positive"
        },
        {
          "field": "Operating Profit (PBDIT) excl Other Income",
          "val1": "1.79",
          "val2": "1.36",
          "chgp": "31.62%",
          "chgp_class": "positive"
        },
        {
          "field": "Interest",
          "val1": "0.26",
          "val2": "0.28",
          "chgp": "-7.14%",
          "chgp_class": "positive"
        },
        {
          "field": "Exceptional Items",
          "val1": "0.00",
          "val2": "0.00",
          "chgp": "",
          "chgp_class": "neutral"
        },
        {
          "field": "Standalone Net Profit",
          "val1": "0.74",
          "val2": "0.62",
          "chgp": "19.35%",
          "chgp_class": "positive"
        },
        {
          "field": "Operating Profit Margin (Excl OI)",
          "val1": "8.32%",
          "val2": "7.85%",
          "chgp": "0.47%",
          "chgp_class": "positive"
        }
      ]
    }
  },
  {
    "link": "half-yearly",
    "btn_text": "All Half Yearly Results",
    "header": "Half Yearly Results Snapshot (Standalone) - Sep'25",
    "rhs": [
      {
        "prefix": "Net Sales ",
        "suffix": " Growth in half year ended Sep 2025 is 2.35% vs 140.09% in Sep 2024",
        "dir": -1
      },
      {
        "prefix": "Standalone Net Profit ",
        "suffix": " Growth in half year ended Sep 2025 is 25.00% vs 378.79% in Sep 2024",
        "dir": -1
      }
    ],
    "table": {
      "header": [
        "Sep'25",
        "Sep'24",
        "Change(%)"
      ],
      "body": [
        {
          "field": "Net Sales",
          "val1": "40.15",
          "val2": "39.23",
          "chgp": "2.35%",
          "chgp_class": "positive"
        },
        {
          "field": "Operating Profit (PBDIT) excl Other Income",
          "val1": "3.13",
          "val2": "2.81",
          "chgp": "11.39%",
          "chgp_class": "positive"
        },
        {
          "field": "Interest",
          "val1": "0.71",
          "val2": "0.75",
          "chgp": "-5.33%",
          "chgp_class": "positive"
        },
        {
          "field": "Exceptional Items",
          "val1": "0.00",
          "val2": "0.00",
          "chgp": "",
          "chgp_class": "neutral"
        },
        {
          "field": "Standalone Net Profit",
          "val1": "1.15",
          "val2": "0.92",
          "chgp": "25.00%",
          "chgp_class": "positive"
        },
        {
          "field": "Operating Profit Margin (Excl OI)",
          "val1": "7.80%",
          "val2": "7.16%",
          "chgp": "0.64%",
          "chgp_class": "positive"
        }
      ]
    }
  },
  {
    "link": "nine-monthly",
    "btn_text": "All Nine Monthly Results",
    "header": "Nine Monthly Results Snapshot (Standalone) - Dec'25",
    "rhs": [
      {
        "prefix": "Net Sales ",
        "suffix": "YoY Growth in nine months ended Dec 2025 is 1.08% vs 113.06% in Dec 2024",
        "dir": -1
      },
      {
        "prefix": "Standalone Net Profit ",
        "suffix": "YoY Growth in nine months ended Dec 2025 is 30.43% vs 335.90% in Dec 2024",
        "dir": -1
      }
    ],
    "table": {
      "header": [
        "Dec'25",
        "Dec'24",
        "Change(%)"
      ],
      "body": [
        {
          "field": "Net Sales",
          "val1": "54.25",
          "val2": "53.67",
          "chgp": "1.08%",
          "chgp_class": "positive"
        },
        {
          "field": "Operating Profit (PBDIT) excl Other Income",
          "val1": "4.01",
          "val2": "3.72",
          "chgp": "7.80%",
          "chgp_class": "positive"
        },
        {
          "field": "Interest",
          "val1": "1.00",
          "val2": "1.15",
          "chgp": "-13.04%",
          "chgp_class": "positive"
        },
        {
          "field": "Exceptional Items",
          "val1": "0.00",
          "val2": "0.00",
          "chgp": "",
          "chgp_class": "neutral"
        },
        {
          "field": "Standalone Net Profit",
          "val1": "1.20",
          "val2": "0.92",
          "chgp": "30.43%",
          "chgp_class": "positive"
        },
        {
          "field": "Operating Profit Margin (Excl OI)",
          "val1": "7.39%",
          "val2": "6.93%",
          "chgp": "0.46%",
          "chgp_class": "positive"
        }
      ]
    }
  },
  {
    "link": "annual",
    "btn_text": "All Annual Results",
    "header": "Annual Results Snapshot (Standalone) - Mar'26",
    "rhs": [
      {
        "prefix": "Net Sales ",
        "suffix": "YoY Growth in year ended Mar 2026 is -1.47% vs 101.02% in Mar 2025",
        "dir": -1
      },
      {
        "prefix": "Standalone Net Profit ",
        "suffix": "YoY Growth in year ended Mar 2026 is 14.47% vs 630.00% in Mar 2025",
        "dir": -1
      }
    ],
    "table": {
      "header": [
        "Mar'26",
        "Mar'25",
        "Change(%)"
      ],
      "body": [
        {
          "field": "Net Sales",
          "val1": "71.58",
          "val2": "72.65",
          "chgp": "-1.47%",
          "chgp_class": "negative"
        },
        {
          "field": "Operating Profit (PBDIT) excl Other Income",
          "val1": "5.37",
          "val2": "5.19",
          "chgp": "3.47%",
          "chgp_class": "positive"
        },
        {
          "field": "Interest",
          "val1": "1.27",
          "val2": "1.53",
          "chgp": "-16.99%",
          "chgp_class": "positive"
        },
        {
          "field": "Exceptional Items",
          "val1": "0.00",
          "val2": "0.00",
          "chgp": "",
          "chgp_class": "neutral"
        },
        {
          "field": "Standalone Net Profit",
          "val1": "1.82",
          "val2": "1.59",
          "chgp": "14.47%",
          "chgp_class": "positive"
        },
        {
          "field": "Operating Profit Margin (Excl OI)",
          "val1": "7.50%",
          "val2": "7.14%",
          "chgp": "0.36%",
          "chgp_class": "positive"
        }
      ]
    }
  }
]

Quarterly Results Snapshot (Standalone) - Jun'26 - QoQstock-summary

Jun'26
Mar'26
Change(%)
Net Sales
21.52
17.33
24.18%
Operating Profit (PBDIT) excl Other Income
1.79
1.36
31.62%
Interest
0.26
0.28
-7.14%
Exceptional Items
0.00
0.00
Standalone Net Profit
0.74
0.62
19.35%
Operating Profit Margin (Excl OI)
8.32%
7.85%
0.47%
Values in Rs Cr.
Direction Arrows
Net Sales

QoQ Growth in quarter ended Jun 2026 is 24.18% vs 22.91% in Mar 2026

Direction Arrows
Standalone Net Profit

QoQ Growth in quarter ended Jun 2026 is 19.35% vs 1,140.00% in Mar 2026

Half Yearly Results Snapshot (Standalone) - Sep'25stock-summary

Sep'25
Sep'24
Change(%)
Net Sales
40.15
39.23
2.35%
Operating Profit (PBDIT) excl Other Income
3.13
2.81
11.39%
Interest
0.71
0.75
-5.33%
Exceptional Items
0.00
0.00
Standalone Net Profit
1.15
0.92
25.00%
Operating Profit Margin (Excl OI)
7.80%
7.16%
0.64%
Values in Rs Cr.
Direction Arrows
Net Sales

Growth in half year ended Sep 2025 is 2.35% vs 140.09% in Sep 2024

Direction Arrows
Standalone Net Profit

Growth in half year ended Sep 2025 is 25.00% vs 378.79% in Sep 2024

Nine Monthly Results Snapshot (Standalone) - Dec'25stock-summary

Dec'25
Dec'24
Change(%)
Net Sales
54.25
53.67
1.08%
Operating Profit (PBDIT) excl Other Income
4.01
3.72
7.80%
Interest
1.00
1.15
-13.04%
Exceptional Items
0.00
0.00
Standalone Net Profit
1.20
0.92
30.43%
Operating Profit Margin (Excl OI)
7.39%
6.93%
0.46%
Values in Rs Cr.
Direction Arrows
Net Sales

YoY Growth in nine months ended Dec 2025 is 1.08% vs 113.06% in Dec 2024

Direction Arrows
Standalone Net Profit

YoY Growth in nine months ended Dec 2025 is 30.43% vs 335.90% in Dec 2024

Annual Results Snapshot (Standalone) - Mar'26stock-summary

Mar'26
Mar'25
Change(%)
Net Sales
71.58
72.65
-1.47%
Operating Profit (PBDIT) excl Other Income
5.37
5.19
3.47%
Interest
1.27
1.53
-16.99%
Exceptional Items
0.00
0.00
Standalone Net Profit
1.82
1.59
14.47%
Operating Profit Margin (Excl OI)
7.50%
7.14%
0.36%
Values in Rs Cr.
Direction Arrows
Net Sales

YoY Growth in year ended Mar 2026 is -1.47% vs 101.02% in Mar 2025

Direction Arrows
Standalone Net Profit

YoY Growth in year ended Mar 2026 is 14.47% vs 630.00% in Mar 2025

stock-summaryCompany CV
About Dynamic Industries Ltd stock-summary
stock-summary
Dynamic Industries Ltd
Micro Cap
Specialty Chemicals
Dynamic Industries Limited was incorporated in 1988. In 1989, the Company was started as a Private Limited Company with the staff of 10 people headed by Dipak Choksi and Harin Mamalatdarna and a production capacity of 120 metric tons per year of reactive dyes. The year 1991 saw the start of non benzydene direct dyes and the export of products. The Company is in the business of manufacturing of Chemical and main product of the Company is Dye and Dye Stuffs.
Company Coordinates stock-summary
Company Details
Plot No 5501/2 Phase III GIDC, Nr Trikampura Cross Rds Vatva Ahmedabad Gujarat : 382445
stock-summary
Tel: 91-079-25897221/22/23
stock-summary
invgrv@dynaind.com/admin@dynaind.co
Registrar Details