
Compare East India Drums with Similar Stocks
Dashboard
Poor Management Efficiency with a low ROCE of 5.30%
- The company has been able to generate a Return on Capital Employed (avg) of 5.30% signifying low profitability per unit of total capital (equity and debt)
Company's ability to service its debt is weak with a poor EBIT to Interest (avg) ratio of 0.54
Healthy long term growth as Net Sales has grown by an annual rate of 202.92% and Operating profit at 70.60%
Flat results in Dec 25
With ROCE of -0.9, it has a Very Expensive valuation with a 4.3 Enterprise value to Capital Employed
Majority shareholders : Promoters
Stock DNA
Trading & Distributors
INR 162 Cr (Micro Cap)
32.00
15
1.47%
1.15
25.39%
8.04
Total Returns (Price + Dividend) 
Latest dividend: 1 per share ex-dividend date: Aug-06-2025
Risk Adjusted Returns v/s
Returns Beta

News

East India Drums & Barrels Manufacturing Ltd is Rated Hold
East India Drums & Barrels Manufacturing Ltd is rated 'Hold' by MarketsMOJO, with this rating last updated on 29 Dec 2025. However, the analysis and financial metrics discussed here reflect the company’s current position as of 31 May 2026, providing investors with an up-to-date view of its fundamentals, returns, and market standing.
Read full news articleWhen is the next results date for East India Drums & Barrels Manufacturing Ltd?
The next results date for East India Drums & Barrels Manufacturing Ltd is scheduled for 29 May 2026....
Read full news article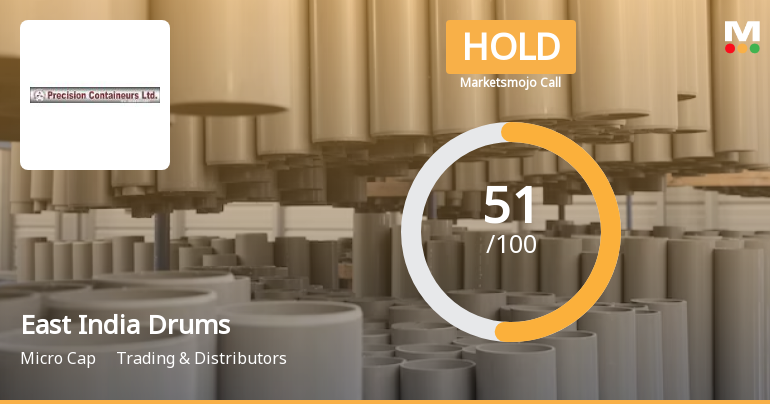
East India Drums & Barrels Manufacturing Ltd is Rated Hold
East India Drums & Barrels Manufacturing Ltd is rated 'Hold' by MarketsMOJO. This rating was assigned on 29 Dec 2025, reflecting a new assessment of the stock’s prospects. However, all fundamentals, returns, and financial metrics discussed below are current as of 20 May 2026, providing investors with an up-to-date view of the company’s position in the market.
Read full news article Announcements
Intimation Under Regulation 30 Of SEBI (LODR) Regulations 2015 - Receipt Of Additional Order From Hindustan Petroleum Corporation Limited .
01-Jun-2026 | Source : BSEIntimation under Regulation 30 of SEBI (LODR) Regulation 2015 - Receipt of Additional Order from Hindustan Petroleum Corporation Limited .
Compliances-Reg.24(A)-Annual Secretarial Compliance
27-May-2026 | Source : BSEAnnual Secretarial Report under regulation 24(A) of SEBI (LODR) Regulation 2015 for the year ended 31-03-2026.
Update on board meeting
25-May-2026 | Source : BSEThe Board Meeting to be held on 29/05/2026 has been revised to 15/07/2026 The Board Meeting to be held on 29/05/2026 has been revised to be held on or before 15/07/2026.
Corporate Actions

15 Jul 2026

East India Drums & Barrels Manufacturing Ltd has declared 10% dividend, ex-date: 06 Aug 25

No Splits history available

No Bonus history available

No Rights history available
Quality key factors
Valuation key factors
Technicals key factors
 Technical Indicator Scale: Bearish, Mildly Bearish, Sideways, Mildly Bullish, Bullish Turned
 Shareholding Snapshot : Mar 2026
Shareholding Compare (%holding)
Promoters
None
Held by 0 Schemes
Held by 0 FIIs
Madhav Jayesh Valia (50.92%)
None
4.05%
Quarterly Results Snapshot (Standalone) - Dec'25 - YoY

YoY Growth in quarter ended Dec 2025 is -14.11% vs 0.00% in Dec 2024
YoY Growth in quarter ended Dec 2025 is 8.25% vs 2,040.00% in Dec 2024
Half Yearly Results Snapshot (Standalone) - Sep'25
Growth in half year ended Sep 2025 is -5.61% vs 0.00% in Sep 2024
Growth in half year ended Sep 2025 is 63.64% vs 1,026.32% in Sep 2024
Nine Monthly Results Snapshot (Standalone) - Dec'25
YoY Growth in nine months ended Dec 2025 is -8.35% vs 0.00% in Dec 2024
YoY Growth in nine months ended Dec 2025 is 43.96% vs 1,237.50% in Dec 2024
Annual Results Snapshot (Standalone) - Mar'25
YoY Growth in year ended Mar 2025 is 0.00% vs 0.00% in Mar 2024
YoY Growth in year ended Mar 2025 is -75.19% vs 7,009.52% in Mar 2024
About East India Drums & Barrels Manufacturing Ltd

Company Coordinates


