
Compare East WestFreight with Similar Stocks
Dashboard
Weak Long Term Fundamental Strength with a -43.93% CAGR growth in Operating Profits over the last 5 years
- Low ability to service debt as the company has a high Debt to EBITDA ratio of 38.30 times
- The company has been able to generate a Return on Equity (avg) of 3.12% signifying low profitability per unit of shareholders funds
The company has declared Negative results for the last 5 consecutive quarters
Consistent Underperformance against the benchmark over the last 3 years
Stock DNA
Transport Services
INR 34 Cr (Micro Cap)
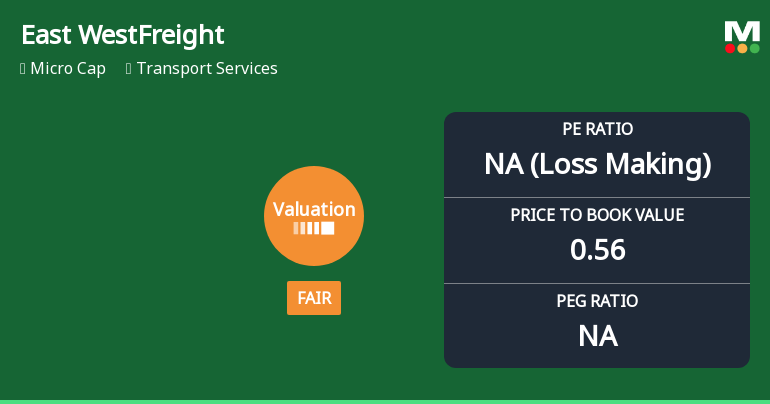
NA (Loss Making)
32
0.00%
1.06
-6.32%
0.55
Total Returns (Price + Dividend) 
Latest dividend: 0 per share ex-dividend date: Dec-17-2020
Risk Adjusted Returns v/s
Returns Beta

News
East West Freight Carriers Ltd Valuation Shifts Amidst Market Challenges
East West Freight Carriers Ltd, a micro-cap player in the transport services sector, has experienced a notable shift in its valuation parameters, moving from an attractive to a fair valuation grade. This change reflects evolving market perceptions amid challenging financial metrics and a prolonged period of underperformance relative to benchmarks such as the Sensex.
Read full news articleAre East West Freight Carriers Ltd latest results good or bad?
East West Freight Carriers Ltd's latest financial results for Q4 FY26 present a complex picture characterized by both recovery in profitability metrics and ongoing challenges in revenue generation. The company reported a consolidated net profit of ₹0.40 crores, marking a notable recovery from a loss in the previous quarter. This recovery is reflected in the significant quarter-on-quarter growth of 117.02% in net profit, indicating improved operational performance in that regard. However, the company's revenue continues to face significant headwinds, with net sales declining to ₹44.31 crores, representing a 24.81% decrease year-on-year and a 2.81% decline from the previous quarter. This marks the seventh consecutive quarter of negative year-on-year revenue growth, suggesting persistent challenges in maintaining market share or responding to sector demand dynamics. The operating margin for the quarter stood...
Read full news article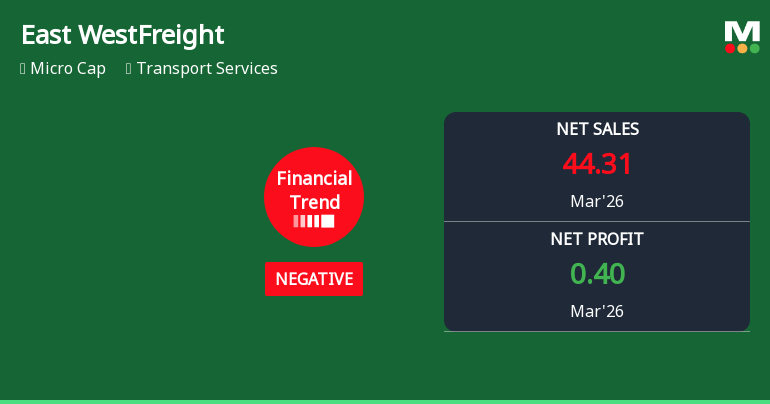
East West Freight Carriers Ltd Reports Mixed Quarterly Results Amid Ongoing Financial Challenges
East West Freight Carriers Ltd has posted a mixed quarterly performance for March 2026, showing some improvement in profitability metrics despite continued pressure on sales and overall financial health. The company’s financial trend has shifted from very negative to negative, reflecting a modest recovery but still signalling caution for investors amid a challenging transport services sector.
Read full news article Announcements
Announcement under Regulation 30 (LODR)-Newspaper Publication
01-Jun-2026 | Source : BSEPublication of the Audited Financial Result for the quarter and year end 31/03/2026 in newspaper.
Revised Outcome Of Board Meeting Held On Friday 29Th May 2026 For Approval Of The Audited Standalone & Consolidated Financial Result For The Finance Year Ended 31St March 2026 And Took On Record The Audit Report With An Unmodified Opinion On The Aforesaid
30-May-2026 | Source : BSERevised outcome of Board Meeting alongwith financial result for the Quarter and Year end 31/03/2026
Board Meeting Outcome for Outcome Of Board Meeting Held On Friday 29Th May 2026
29-May-2026 | Source : BSEOutcome of Board Meeting held on Friday 29th May 2026
Corporate Actions

No Upcoming Board Meetings


East West Freight Carriers Ltd has announced 2:10 stock split, ex-date: 30 Mar 21

East West Freight Carriers Ltd has announced 1:4 bonus issue, ex-date: 30 Mar 21

No Rights history available
Quality key factors
Valuation key factors
Technicals key factors
 Technical Indicator Scale: Bearish, Mildly Bearish, Sideways, Mildly Bullish, Bullish Turned
 Shareholding Snapshot : Mar 2026
Shareholding Compare (%holding)
Promoters
None
Held by 0 Schemes
Held by 1 FIIs (0.06%)
Mohammad Shafi (38.72%)
Gautam Anand (2.37%)
31.96%
Quarterly Results Snapshot (Consolidated) - Mar'26 - QoQ

QoQ Growth in quarter ended Mar 2026 is -2.81% vs -17.36% in Dec 2025
QoQ Growth in quarter ended Mar 2026 is 117.02% vs -38.24% in Dec 2025
Half Yearly Results Snapshot (Consolidated) - Sep'25

Growth in half year ended Sep 2025 is -30.58% vs 63.72% in Sep 2024
Growth in half year ended Sep 2025 is -731.25% vs 220.00% in Sep 2024
Nine Monthly Results Snapshot (Consolidated) - Dec'25
YoY Growth in nine months ended Dec 2025 is -30.52% vs 61.34% in Dec 2024
YoY Growth in nine months ended Dec 2025 is -550.52% vs 193.94% in Dec 2024
Annual Results Snapshot (Consolidated) - Mar'26
YoY Growth in year ended Mar 2026 is -29.33% vs 36.89% in Mar 2025
YoY Growth in year ended Mar 2026 is -408.53% vs -79.75% in Mar 2025
About East West Freight Carriers Ltd

Company Coordinates


