
Compare ESI with Similar Stocks
Dashboard
With a Operating Losses, the company has a Weak Long Term Fundamental Strength
- Poor long term growth as Net Sales has grown by an annual rate of -23.52% and Operating profit at -254.80% over the last 5 years
- Low ability to service debt as the company has a high Debt to EBITDA ratio of -10.24 times
Flat results in Mar 26
Risky - Negative EBITDA
Reducing Promoter Confidence
Stock DNA
Textile
INR 28 Cr (Micro Cap)
NA (Loss Making)
23
0.00%
0.00
0.00%
0.75
Total Returns (Price + Dividend) 
Latest dividend: 0.12 per share ex-dividend date: Sep-08-2010
Risk Adjusted Returns v/s
Returns Beta

News

Eastern Silk Industries Ltd Locks at Upper Circuit With 4.99% Gain — Buyers Queue, Sellers Absent
At Rs 54.71, the buying was done — not because demand dried up, but because the exchange wouldn't let the stock go any higher. Eastern Silk Industries Ltd locked at its upper circuit of 4.97% on 08 Jun 2026, with buyers queuing and no sellers willing to part with shares.
Read full news article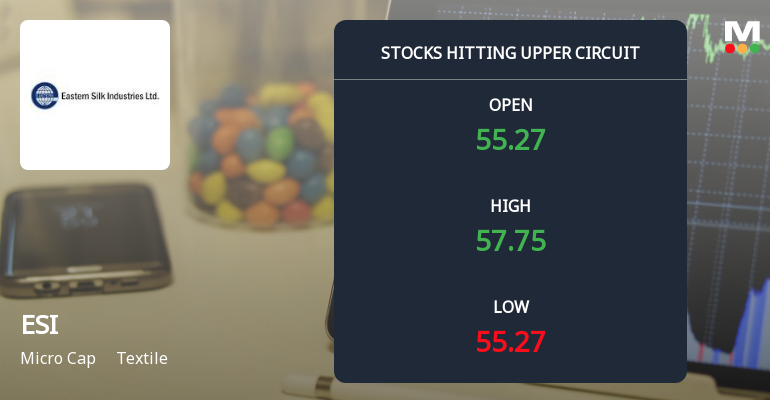
Eastern Silk Industries Ltd Locks at Upper Circuit With 5.0% Gain — Buyers Queue, Sellers Absent
At Rs 57.75, the buying was done — not because demand dried up, but because the exchange wouldn't let the stock go any higher. Eastern Silk Industries Ltd locked at its upper circuit of 5.0% on 2 Jun 2026, with buyers queuing and no sellers willing to part with shares.
Read full news article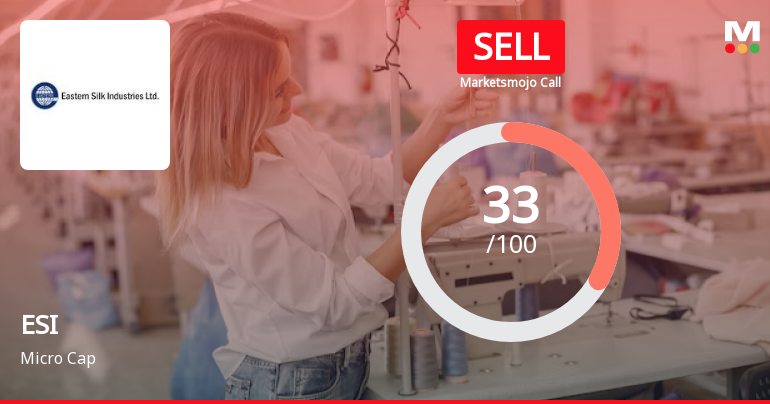
Eastern Silk Industries Ltd is Rated Sell
Eastern Silk Industries Ltd is rated 'Sell' by MarketsMOJO, with this rating last updated on 23 Mar 2026. However, the analysis and financial metrics discussed here reflect the stock's current position as of 28 May 2026, providing investors with an up-to-date view of the company’s fundamentals, valuation, financial trends, and technical outlook.
Read full news article Announcements
Newspaper Clippings Of Publication Of Audited Financial Results Under Regulation 47 Of The SEBI (Listing Obligations & Disclosure Requirements) Regulations 2015
28-May-2026 | Source : BSEPursuant to Regulation 47 of Sebi (Listing Obligations and Disclosure Requirements) Regulations 2015 Please find enclosed clipping of Newspaper Publication in Financial Express and Arthik Lippi
Board Meeting Intimation for Prior Intimation Of The Board Meeting Under Regulation 29 Of Securities And Exchange Board Of India (Listing Obligations And Disclosure Requirements) Regulations 2015
14-May-2026 | Source : BSEEastern Silk Industries Ltdhas informed BSE that the meeting of the Board of Directors of the Company is scheduled on 27/05/2026 inter alia to consider and approve the Audited Standalone Financial Results of the Company for the financial year ended on March 31 2026.
Compliances-Reg.24(A)-Annual Secretarial Compliance
13-May-2026 | Source : BSEWith reference to the captioned Subject please find enclosed here with a copy of Annual Secretarial Compliance Report of the company for the year ended March 31 2026
Corporate Actions

No Upcoming Board Meetings

Eastern Silk Industries Ltd has declared 6% dividend, ex-date: 08 Sep 10

Eastern Silk Industries Ltd has announced 2:10 stock split, ex-date: 27 Jun 08

No Bonus history available

No Rights history available
Quality key factors
Valuation key factors
Technicals key factors
 Technical Indicator Scale: Bearish, Mildly Bearish, Sideways, Mildly Bullish, Bullish Turned
 Shareholding Snapshot : Mar 2026
Shareholding Compare (%holding)
Promoters
None
Held by 0 Schemes
Held by 0 FIIs
Baumann Dekor Pvt.ltd. (92.23%)
None
6.72%
Quarterly Results Snapshot (Standalone) - Dec'25 - QoQ

QoQ Growth in quarter ended Dec 2025 is 29.80% vs -25.71% in Sep 2025
QoQ Growth in quarter ended Dec 2025 is 200.00% vs -78.95% in Sep 2025
Half Yearly Results Snapshot (Standalone) - Sep'25

Growth in half year ended Sep 2025 is -6.09% vs 21.17% in Sep 2024
Growth in half year ended Sep 2025 is -170.27% vs 110.48% in Sep 2024
Nine Monthly Results Snapshot (Standalone) - Dec'25
YoY Growth in nine months ended Dec 2025 is 4.84% vs 10.78% in Dec 2024
YoY Growth in nine months ended Dec 2025 is -130.51% vs 105.65% in Dec 2024
Annual Results Snapshot (Standalone) - Mar'26
YoY Growth in year ended Mar 2026 is 9.87% vs 14.06% in Mar 2025
YoY Growth in year ended Mar 2026 is -443.43% vs 132.20% in Mar 2025
About Eastern Silk Industries Ltd

Company Coordinates


