
Compare Ebara Corp. with Similar Stocks
Dashboard
Strong Long Term Fundamental Strength with a 26.49% CAGR growth in Operating Profits
- Company's ability to service its debt is strong with a healthy EBIT to Interest (avg) ratio of 29.08
- The company has been able to generate a Return on Capital Employed (avg) of 19.86% signifying high profitability per unit of total capital (equity and debt)
With ROE of 16.17%, it has a very attractive valuation with a 2.22 Price to Book Value
Market Beating Performance
Stock DNA
Industrial Manufacturing
JPY 1,431,911 Million (Large Cap)
14.00
NA
0.00%
-0.03
15.92%
2.99
Total Returns (Price + Dividend) 
Ebara Corp. for the last several years.
Risk Adjusted Returns v/s
News

Ebara Corp. Stock Soars 5.42% to Intraday High Amid Market Decline
Ebara Corp. has seen a notable rise in stock performance, achieving significant gains amid a declining market. The company has demonstrated resilience over the past week and month, with impressive one-year returns. Its strong fundamentals, including a solid market capitalization and profitability metrics, underscore its robust position in the industrial manufacturing sector.
Read full news article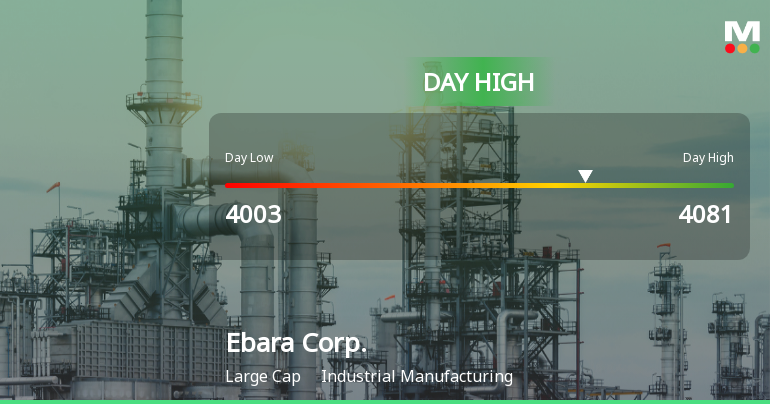
Ebara Corp. Hits Day High with 4.7% Surge in Strong Intraday Performance
Ebara Corp. has seen significant stock performance, with a notable increase on October 27, 2025. Over the past month, the company has outperformed the Japan Nikkei 225, and year-to-date growth has been substantial. Strong fundamentals, including a high EBIT to interest ratio and solid profitability metrics, support its market position.
Read full news article Announcements

Corporate Actions
Quality key factors
Valuation key factors
Technicals key factors
 Technical Indicator Scale: Bearish, Mildly Bearish, Sideways, Mildly Bullish, Bullish Turned
 Shareholding Snapshot : Mar 2021
Shareholding Compare (%holding)
Foreign Institutions
Held in 0 Schemes (0%)
Held by 1 Foreign Institutions (0.35%)
Quarterly Results Snapshot (Consolidated) - Jun'25 - YoY

YoY Growth in quarter ended Jun 2025 is 17.64% vs 11.65% in Jun 2024

YoY Growth in quarter ended Jun 2025 is 6.75% vs 14.14% in Jun 2024
Annual Results Snapshot (Consolidated) - Dec'24
YoY Growth in year ended Dec 2024 is 14.14% vs 11.52% in Dec 2023
YoY Growth in year ended Dec 2024 is 16.76% vs 21.05% in Dec 2023
About Ebara Corp.

Company Coordinates


