
Total Returns (Price + Dividend) 
E.C.D. Automotive Design, Inc. for the last several years.
Risk Adjusted Returns v/s
News
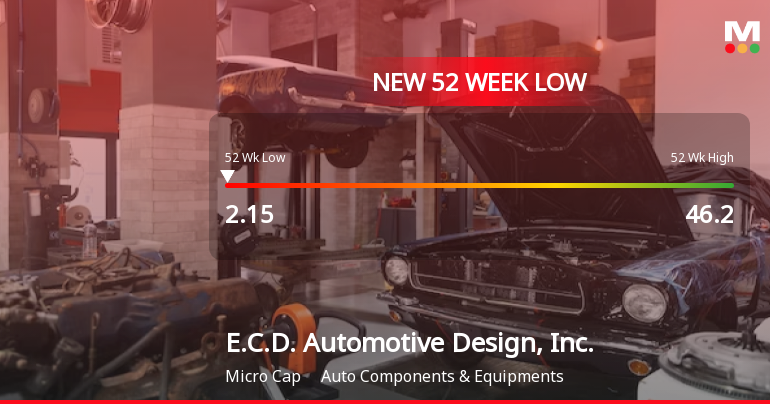
E.C.D. Automotive Design Hits New 52-Week Low at $2.15
E.C.D. Automotive Design, Inc. has reached a new 52-week low, reflecting significant challenges despite a strong annual return. The company's market capitalization is USD 6 million, with a negative debt-equity ratio and no dividend payments. Institutional investor participation has decreased, indicating caution regarding the company's future prospects.
Read MoreIs E.C.D. Automotive Design, Inc. technically bullish or bearish?
As of 12 September 2025, the technical trend for E.C.D. Automotive Design, Inc. has changed from mildly bearish to bearish. The current stance is bearish with weak strength indicated by the weekly MACD being bullish but the RSI and KST both bearish. The daily moving averages are mildly bearish, while the Bollinger Bands show bullishness on both weekly and monthly time frames. The stock has significantly outperformed the S&P 500 over the past week and month, but remains behind on a year-to-date and yearly basis....
Read MoreIs E.C.D. Automotive Design, Inc. overvalued or undervalued?
As of 10 May 2023, the valuation grade for E.C.D. Automotive Design, Inc. has moved from does not qualify to risky, indicating a shift in perception regarding its financial health. The company appears to be overvalued based on its current metrics, particularly with a P/E ratio of -0.4518 and an EV to EBITDA of -3.8484, which are significantly negative compared to industry standards. In comparison to its peers, E.C.D. Automotive Design, Inc. shows a stark contrast, as evidenced by the lack of a PEG ratio and the negative EV to EBITDA, suggesting that it is not performing well relative to its competitors. For instance, while E.C.D. has a risky valuation, other companies in the auto components and equipment sector maintain more stable ratios. Additionally, the company's stock has returned 350% year-to-date, which, while impressive, still lags behind the S&P 500's 12.22% return, reinforcing the notion that it...
Read More Announcements

Corporate Actions
Quality key factors
Valuation key factors
Technicals key factors
 Technical Indicator Scale: Bearish, Mildly Bearish, Sideways, Mildly Bullish, Bullish Turned
 Shareholding Snapshot : Mar 2025
Shareholding Compare (%holding)
Foreign Institutions
Held in 3 Schemes (0.24%)
Held by 7 Foreign Institutions (0.41%)
Quarterly Results Snapshot (Consolidated) - Jun'25 - YoY

YoY Growth in quarter ended Jun 2025 is 7.69% vs 66.67% in Jun 2024
YoY Growth in quarter ended Jun 2025 is -115.00% vs 0.00% in Jun 2024
Annual Results Snapshot (Consolidated) - Dec'24
YoY Growth in year ended Dec 2024 is 29.23% vs 103.12% in Dec 2023
YoY Growth in year ended Dec 2024 is -800.00% vs 50.00% in Dec 2023
About E.C.D. Automotive Design, Inc.

Company Coordinates


