
Compare Econo Trade Indi with Similar Stocks
Stock DNA
Non Banking Financial Company (NBFC)
INR 11 Cr (Micro Cap)
5.00
21
0.00%
0.41
4.54%
0.24
Total Returns (Price + Dividend) 
Econo Trade Indi for the last several years.
Risk Adjusted Returns v/s
Returns Beta

News
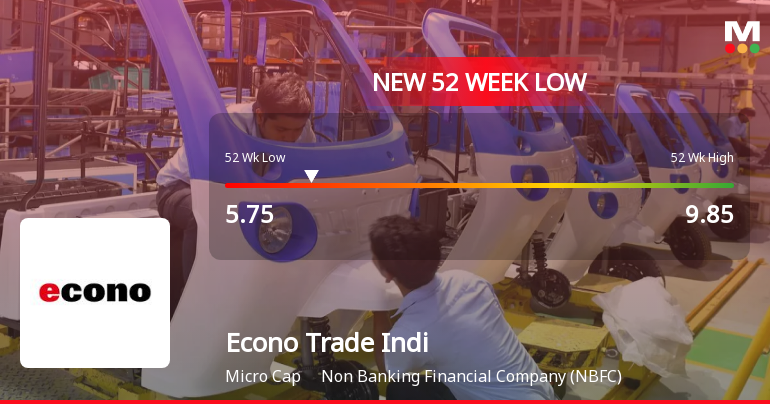
Econo Trade India Ltd Falls to 52-Week Low of Rs 5.75 as Sell-Off Deepens
For the fifth consecutive session, Econo Trade India Ltd closed lower, slipping to a fresh 52-week low of Rs 5.75 on 14 Jul 2026. This decline comes amid a broader market that remains volatile but with the Sensex trading above its 50-day moving average, highlighting a stark divergence in performance.
Read full news article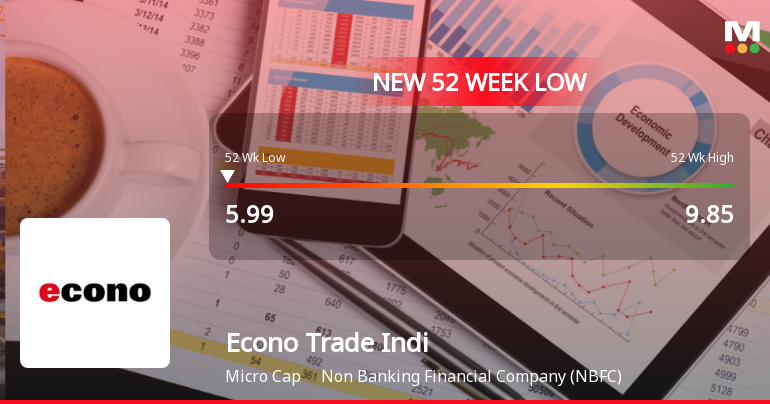
Econo Trade India Ltd Falls to 52-Week Low Amidst Persistent Underperformance
A sharp decline has pushed Econo Trade India Ltd to within 1.8% of its 52-week low of Rs 5.99, marking a significant setback for the micro-cap NBFC. This drop comes despite a market environment where the Sensex has shown resilience, highlighting a divergence that raises questions about the stock’s outlook.
Read full news article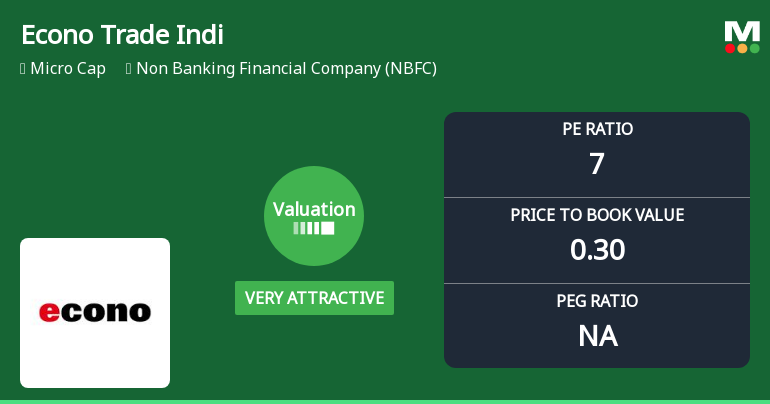
Econo Trade India Ltd Valuation Shifts Signal Renewed Price Attractiveness
Econo Trade India Ltd, a micro-cap player in the Non Banking Financial Company (NBFC) sector, has witnessed a notable shift in its valuation parameters, moving from an attractive to a very attractive price range. This change, reflected in key metrics such as the price-to-earnings (P/E) and price-to-book value (P/BV) ratios, offers investors a fresh perspective on the stock’s price attractiveness amid a challenging market backdrop.
Read full news article Announcements
Compliances-Certificate under Reg. 74 (5) of SEBI (DP) Regulations 2018
10-Jul-2026 | Source : BSEPlease find the attachment
EXPLANATION FOR LATE INTIMATION UNDER REGULATION 30 OF THE SEBI (LISTING OBLIGATIONS AND DISCLOSURE REQUIREMENTS) REGULATIONS 2015.
08-Jul-2026 | Source : BSEPlease find the attachment reguarding the reply for delay submission
INTIMATION UNDER REGULATION 30 OF THE SEBI (LISTING OBLIGATIONS AND DISCLOSURE REQUIREMENTS) REGULATIONS 2015 - RECEIPT OF AN ORDER PASSED BY SEBI.
07-Jul-2026 | Source : BSEPlease find the attachment
Corporate Actions

No Upcoming Board Meetings

No Dividend history available

No Splits history available

No Bonus history available

No Rights history available
Quality key factors
Valuation key factors
Technicals key factors
 Technical Indicator Scale: Bearish, Mildly Bearish, Sideways, Mildly Bullish, Bullish Turned
 Shareholding Snapshot : Jun 2026
Shareholding Compare (%holding)
Non Institution
None
Held by 0 Schemes
Held by 0 FIIs
Robert Resources Limited (11.01%)
Arpan Das (3.4%)
52.11%
Quarterly Results Snapshot (Standalone) - Mar'26 - QoQ

QoQ Growth in quarter ended Mar 2026 is 9.93% vs 3.42% in Dec 2025

QoQ Growth in quarter ended Mar 2026 is -48.44% vs -4.48% in Dec 2025
Half Yearly Results Snapshot (Standalone) - Sep'25
Growth in half year ended Sep 2025 is 3.00% vs -8.25% in Sep 2024
Growth in half year ended Sep 2025 is 15.24% vs 8.25% in Sep 2024
Nine Monthly Results Snapshot (Standalone) - Dec'25
YoY Growth in nine months ended Dec 2025 is 5.97% vs -12.23% in Dec 2024
YoY Growth in nine months ended Dec 2025 is 19.35% vs 2.65% in Dec 2024
Annual Results Snapshot (Standalone) - Mar'26
YoY Growth in year ended Mar 2026 is -7.79% vs -9.96% in Mar 2025
YoY Growth in year ended Mar 2026 is -3.54% vs -10.67% in Mar 2025
About Econo Trade India Ltd

Company Coordinates


