
Compare Ecoplast with Similar Stocks
Dashboard
With ROE of 9.1, it has a Expensive valuation with a 1.9 Price to Book Value
- The stock is trading at a premium compared to its peers' average historical valuations
- Over the past year, while the stock has generated a return of -18.79%, its profits have risen by 3.6%
Underperformed the market in the last 1 year
Stock DNA
Plastic Products - Industrial
INR 233 Cr (Micro Cap)
21.00
21
0.00%
-0.09
9.06%
1.93
Total Returns (Price + Dividend) 
Latest dividend: 3 per share ex-dividend date: Aug-08-2024
Risk Adjusted Returns v/s
Returns Beta

News

Ecoplast Ltd is Rated Sell by MarketsMOJO
Ecoplast Ltd is rated 'Sell' by MarketsMOJO, with this rating last updated on 07 Nov 2025. However, the analysis and financial metrics discussed here reflect the stock's current position as of 17 July 2026, providing investors with an up-to-date view of the company’s performance and outlook.
Read full news article
Ecoplast Ltd is Rated Sell
Ecoplast Ltd is rated 'Sell' by MarketsMOJO, with this rating last updated on 07 Nov 2025. However, the analysis and financial metrics discussed here reflect the stock's current position as of 06 July 2026, providing investors with the latest insights into the company’s performance and outlook.
Read full news article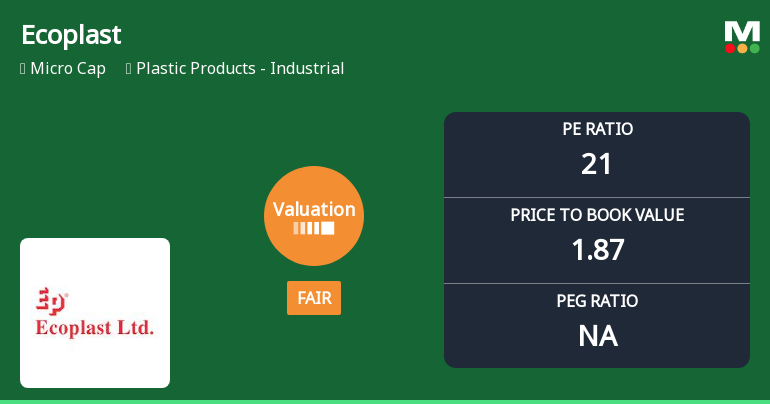
Ecoplast Ltd Valuation Shifts Signal Improved Price Attractiveness Amid Mixed Returns
Ecoplast Ltd, a micro-cap player in the Plastic Products - Industrial sector, has witnessed a notable shift in its valuation parameters, moving from an expensive to a fair valuation grade. This change, coupled with its recent market performance and peer comparisons, offers investors a nuanced perspective on the stock's price attractiveness and potential investment appeal.
Read full news article Announcements
Compliances-Certificate under Reg. 74 (5) of SEBI (DP) Regulations 2018
03-Jul-2026 | Source : BSECompliance Certificate under Reg 74 (5) of SEBI (DP) Regulation 2018 for the quarter ended June 30 2026.
Announcement under Regulation 30 (LODR)-Newspaper Publication
20-Jun-2026 | Source : BSENewspaper Advertisement for Transfer of shares into Investor Education and Protection fund Authority.
Closure of Trading Window
17-Jun-2026 | Source : BSEIntimation of closure of Trading Window.
Corporate Actions

No Upcoming Board Meetings

Ecoplast Ltd has declared 30% dividend, ex-date: 08 Aug 24

No Splits history available

No Bonus history available

No Rights history available
Quality key factors
Valuation key factors
Technicals key factors
 Technical Indicator Scale: Bearish, Mildly Bearish, Sideways, Mildly Bullish, Bullish Turned
 Shareholding Snapshot : Jun 2026
Shareholding Compare (%holding)
Promoters
None
Held by 0 Schemes
Held by 0 FIIs
Amita Jaymin Desai (21.55%)
Anil Kumar Goel (1.35%)
20.52%
Quarterly Results Snapshot (Consolidated) - Mar'26 - QoQ

QoQ Growth in quarter ended Mar 2026 is 2.80% vs 56.20% in Dec 2025

QoQ Growth in quarter ended Mar 2026 is 106.36% vs 8.91% in Dec 2025
Half Yearly Results Snapshot (Consolidated) - Sep'25
Growth in half year ended Sep 2025 is 15.34% vs 9.72% in Sep 2024
Growth in half year ended Sep 2025 is -5.31% vs -5.66% in Sep 2024
Nine Monthly Results Snapshot (Consolidated) - Dec'25
YoY Growth in nine months ended Dec 2025 is 33.72% vs 12.38% in Dec 2024
YoY Growth in nine months ended Dec 2025 is -2.33% vs 0.16% in Dec 2024
Annual Results Snapshot (Consolidated) - Mar'26
YoY Growth in year ended Mar 2026 is 6.40% vs 83.16% in Mar 2025
YoY Growth in year ended Mar 2026 is -15.24% vs 54.53% in Mar 2025
About Ecoplast Ltd

Company Coordinates


