Ecoplast

  • Market Cap: Micro Cap
  • Industry: Plastic Products - Industrial
  • ISIN: INE423D01010
  • NSEID:
  • BSEID: 526703
INR
464.95
28.5 (6.53%)
BSENSE

Feb 10

BSE+NSE Vol: 239

  • Price Points
  • Score
  • Mojo Parameters
  • Total Return
  • News and Corporate Actions
  • Key factors
  • Shareholding
  • Financials
  • CompanyCV
stock-summaryPrice Point
High/Low

1Day

52 Week

Valuation
Technical
Day's Volume

CASH

239 (-44.70%) Volume

Shareholding (Dec 2025)

FII

0.00%

Held by 0 FIIs

DII

0.00%

Held by 0 DIIs

Promoter

64.84%

Who are the top shareholders of the Ecoplast?

06-Jun-2025

The top shareholder of Ecoplast is Amita Jaymin Desai, holding 17.11% of shares, with no pledged promoter holdings. The highest public shareholder is Anil Kumar Goel at 1.84%, while individual investors collectively own 28.75%.

The top shareholders of Ecoplast include the promoters, with Amita Jaymin Desai holding the largest share at 17.11%. There are no pledged promoter holdings, and the company does not have any mutual funds or foreign institutional investors (FIIs) holding shares. The highest public shareholder is Anil Kumar Goel, who holds 1.84%. Additionally, individual investors collectively hold 28.75% of the company's shares.

View full answer

What does Ecoplast do?

06-Jun-2025

Ecoplast Ltd specializes in multilayer co-extruded polyethylene and copolymer films for flexible packaging. As of March 2025, it reported net sales of 32 Cr and a net profit of 2 Cr, with a market cap of Rs 195 Cr.

Overview: <BR>Ecoplast Ltd is a reputed supplier in the plastic products industry, specifically focusing on multilayer co-extruded polyethylene and copolymer films for flexible packaging applications.<BR><BR>History: <BR>Ecoplast Ltd was incorporated in India and has maintained its status as a supplier in the flexible packaging industry. The latest quarterly results reported net sales and profit for the period ending March 2025.<BR><BR>Financial Snapshot: <BR>Most recent Net Sales: 32 Cr (Quarterly Results - Mar 2025) <BR>Most recent Net Profit: 2 Cr (Quarterly Results - Mar 2025) <BR>Market-cap value: Rs 195 Cr (Micro Cap)<BR><BR>Key Metrics: <BR>P/E: 24.00 <BR>Industry P/E: 21 <BR>Dividend Yield: 0.45% <BR>Debt Equity: -0.37 <BR>Return on Equity: 11.37% <BR>Price to Book: 2.71 <BR><BR>Contact Details: <BR>Address: No 8 National Highway, Water Works Cross Road Abrama Valsad Gujarat : 396002 <BR>Tel: 91-2632-254137/254153/249190 <BR>Email: ecoval@ecoplastindia.com <BR>Website: http://www.ecoplastindia.com

View full answer

When is the next results date for Ecoplast?

06-Jun-2025

No Upcoming Board Meetings

Who are in the management team of Ecoplast?

06-Jun-2025

As of March 2023, the management team of Ecoplast includes Jaymin B Desai (Managing Director), Mukul B Desai (Chairman & Independent Director), Bhupendra M Desai (Non-Executive & Independent Director), Charulata Patel (Non-Executive & Non-Independent Director), Dhananjay Thakorbhai Desai (Independent Director), Atul Baijal (Whole-time Director), and Rakesh Kumar Kumawat (Company Secretary & Compliance Officer). Each member contributes to the company's governance and operations.

As of March 2023, the management team of Ecoplast includes the following individuals:<BR><BR>1. **Jaymin B Desai** - Managing Director<BR>2. **Mukul B Desai** - Chairman & Independent Director<BR>3. **Bhupendra M Desai** - Non-Executive & Independent Director<BR>4. **Charulata Patel** - Non-Executive & Non-Independent Director<BR>5. **Dhananjay Thakorbhai Desai** - Independent Director<BR>6. **Atul Baijal** - Whole-time Director<BR>7. **Rakesh Kumar Kumawat** - Company Secretary & Compliance Officer<BR><BR>Each member plays a distinct role in the governance and operational management of the company.

View full answer

Has Ecoplast declared dividend?

06-Jun-2025

Ecoplast Ltd has declared a 30% dividend, amounting to 3 per share, with an ex-date of August 8, 2024. The company has shown strong performance, with total returns over various periods ranging from 5.89% in 6 months to 733.58% over 4 years.

Ecoplast Ltd has declared a 30% dividend.<BR><BR>Dividend Details:<BR>- Percentage announced: 30%<BR>- Amount per share: 3 per share<BR>- Ex-date: 08 Aug 24<BR><BR>Dividend Yield: 0.45%.<BR><BR>Total Returns by Period:<BR>In the 6-month period, the price return was 5.89%, with a dividend return of 0%, resulting in a total return of 5.89%.<BR><BR>For the 1-year period, the price return was 60.84%, the dividend return was 0.80%, leading to a total return of 61.64%.<BR><BR>Over the 2-year period, the price return was 408.17%, with a dividend return of 3.17%, culminating in a total return of 411.34%.<BR><BR>In the 3-year period, the price return reached 589.45%, the dividend return was 5.46%, resulting in a total return of 594.91%.<BR><BR>For the 4-year period, the price return was 727.93%, with a dividend return of 5.65%, leading to a total return of 733.58%.<BR><BR>In the 5-year period, the price return was 681.25%, the dividend return was 7.65%, culminating in a total return of 688.9%.<BR><BR>Overall, Ecoplast Ltd has declared a significant dividend, and the total returns over various periods indicate strong performance, particularly in price appreciation, suggesting a positive outlook for investors.

View full answer

Who are the peers of the Ecoplast?

03-Jun-2025

Ecoplast's peers include Supreme Inds., Astral, Finolex Inds., Garware Hi Tech, Shaily Engineer, Caprihans India, Tainwala Chem., Bright Brothers, and Texmo Pipes. Shaily Engineer has the highest 1-year return at 199.86%, while Ecoplast's return is 58.26%, and it has below-average growth compared to its peers.

Peers: The peers of Ecoplast are Supreme Inds., Astral, Finolex Inds., Garware Hi Tech, Shaily Engineer., Caprihans India, Tainwala Chem., Bright Brothers, and Texmo Pipes.<BR><BR>Quality Snapshot: Excellent management risk is observed at Supreme Inds., while Good management risk is found at Astral, Finolex Inds., and Shaily Engineer., and the rest have Average or Below Average management risk. Growth is Excellent at Bright Brothers and Good at Astral, Shaily Engineer., and Garware Hi Tech, while Average growth is seen at Supreme Inds. and Garware Hi Tech, and Below Average growth is noted at Ecoplast, Finolex Inds., Caprihans India, Tainwala Chem., and Texmo Pipes. Excellent capital structure is present at Supreme Inds., Astral, Finolex Inds., and Garware Hi Tech, while Good capital structure is seen at Shaily Engineer., and the rest have Below Average capital structure.<BR><BR>Return Snapshot: The peer with the highest 1-year return is Shaily Engineer. at 199.86%, while the lowest is Finolex Inds. at -34.80%. Ecoplast's own 1-year return is 58.26%, which is significantly higher than Finolex Inds. but lower than Shaily Engineer. Additionally, peers with negative six-month returns include Supreme Inds., Finolex Inds., Caprihans India, Tainwala Chem., and Guj. Toolroom.

View full answer

What is the technical trend for Ecoplast?

09-Jun-2025

As of June 4, 2025, Ecoplast's technical trend is mildly bullish, though mixed signals from indicators like the MACD, RSI, and Bollinger Bands suggest caution is warranted.

As of 4 June 2025, the technical trend for Ecoplast has changed from sideways to mildly bullish. The daily moving averages indicate a mildly bullish stance, while the weekly MACD and RSI show mildly bearish and bearish signals respectively. The Bollinger Bands present a mixed view with a bearish weekly and mildly bullish monthly outlook. The KST is bullish on the weekly but mildly bearish on the monthly, and Dow Theory reflects a mildly bearish weekly stance against a bullish monthly perspective. Overall, the current technical stance is mildly bullish, but caution is advised due to the mixed signals from various indicators.

View full answer

How big is Ecoplast?

24-Jul-2025

As of 24th July, Ecoplast Ltd has a market capitalization of 202.00 Cr, classifying it as a Micro Cap company, with recent Net Sales of 126.59 Cr and a Net Profit of 8.45 Cr.

As of 24th July, Ecoplast Ltd has a market capitalization of 202.00 Cr, which categorizes it as a Micro Cap company.<BR><BR>In the latest four quarters, Ecoplast reported Net Sales of 126.59 Cr and a Net Profit of 8.45 Cr.<BR><BR>The latest annual period for the balance sheet is March 2025, showing Shareholder's Funds of 74.34 Cr and Total Assets of 87.40 Cr.

View full answer

How has been the historical performance of Ecoplast?

09-Nov-2025

Ecoplast has shown a consistent increase in net sales and total operating income from March 2022 to March 2025, despite rising expenditures impacting profitability. While profit after tax decreased slightly in 2025, the company's total assets grew significantly, indicating overall growth despite cash flow challenges.

Answer:<BR>The historical performance of Ecoplast shows a fluctuating trend in its financial metrics over the years, with notable improvements in recent periods.<BR><BR>Breakdown:<BR>Ecoplast's net sales have increased from 94.18 Cr in March 2022 to 126.59 Cr in March 2025, reflecting a consistent upward trend. The total operating income followed a similar trajectory, rising from 94.18 Cr in March 2022 to 126.59 Cr in March 2025. However, the total expenditure also rose, from 93.85 Cr in March 2022 to 114.32 Cr in March 2025, which impacted the operating profit, which peaked at 14.93 Cr in March 2025, slightly down from 14.95 Cr in March 2024. The profit before tax showed fluctuations, reaching 11.48 Cr in March 2025, down from 12.14 Cr in March 2024. The profit after tax was 8.46 Cr in March 2025, a decrease from 9.17 Cr in March 2024, but significantly higher than the losses reported in March 2022. The company's total assets increased from 54.63 Cr in March 2024 to 87.40 Cr in March 2025, while total liabilities also rose from 54.63 Cr to 87.40 Cr in the same period. Cash flow from operating activities decreased from 12 Cr in March 2024 to 5 Cr in March 2025, while cash flow from financing activities saw a significant increase to 23 Cr in March 2025. Overall, Ecoplast's financial performance indicates growth in sales and assets, despite some challenges in profitability and cash flow management.

View full answer

Is Ecoplast overvalued or undervalued?

20-Nov-2025

As of November 19, 2025, Ecoplast is considered very expensive and overvalued compared to its peers, with a PE Ratio of 21.14 and a year-to-date stock performance of -27.10%, significantly underperforming the Sensex's 9.02%.

As of 19 November 2025, Ecoplast's valuation grade has moved from expensive to very expensive, indicating a significant increase in perceived overvaluation. The company is currently deemed overvalued based on its key financial ratios, including a PE Ratio of 21.14, an EV to EBIT of 17.89, and an EV to EBITDA of 12.72. <BR><BR>In comparison to its peers, Ecoplast's valuation stands out unfavorably; for instance, Garware Hi Tech has a much higher PE Ratio of 30.54, while AGI Greenpac offers a more attractive PE of 14.06. This suggests that Ecoplast's current valuation does not align well with the market, especially considering its recent stock performance, which has underperformed against the Sensex with a year-to-date return of -27.10% compared to the Sensex's 9.02%. Overall, Ecoplast appears to be overvalued in the current market environment.

View full answer

Are Ecoplast Ltd latest results good or bad?

06-Feb-2026

Ecoplast Ltd's latest Q3 FY26 results are concerning, showing an 8.03% revenue growth to ₹36.07 crores, but a significant 33.49% drop in net profit to ₹1.41 crores and a decline in operating margin to 7.21%, indicating operational inefficiencies and rising costs. Overall, the performance is poor despite the revenue increase, raising concerns for investors.

Ecoplast Ltd's latest results for Q3 FY26 indicate a challenging financial situation. While the company achieved a revenue growth of 8.03% year-on-year, reaching ₹36.07 crores, this positive aspect is overshadowed by a significant decline in profitability. The net profit dropped by 33.49% year-on-year to ₹1.41 crores, and the operating margin fell sharply to 7.21%, down from 10.12% a year earlier.<BR><BR>This disconnect between revenue growth and declining profits suggests that the company is facing operational inefficiencies and rising costs, particularly in employee expenses, which increased by 28.57% year-on-year. Furthermore, the profit after tax margin also contracted to 3.91%, reflecting not only operational challenges but also a higher effective tax rate.<BR><BR>Overall, the results highlight severe margin compression and operational difficulties, indicating that the latest performance can be characterized as poor despite the revenue growth. Investors should be cautious, as the combination of declining profits and increasing costs raises concerns about the company's future profitability and operational efficiency.

View full answer

Should I buy, sell or hold Ecoplast Ltd?

06-Feb-2026

Why is Ecoplast Ltd falling/rising?

09-Feb-2026

As of 09-Feb, the stock price of Ecoplast Ltd is currently at 443.00, reflecting a decline of 2.1 (-0.47%) after a trend reversal. The stock has underperformed significantly over the past year, with a 27.38% decline, while the Sensex has risen by 7.97%.

As of 09-Feb, the stock price of Ecoplast Ltd is falling, currently at 443.00, which represents a decrease of 2.1 (-0.47%). This decline follows a trend reversal after two consecutive days of gains. The stock has underperformed its sector by 1.43% today and reached an intraday low of Rs 429.1, indicating a drop of 3.59%. <BR><BR>In terms of performance over different periods, the stock has seen a significant decline of 27.38% over the past year, while the benchmark Sensex has increased by 7.97% in the same timeframe. Additionally, the stock has a year-to-date decline of 9.00%, compared to a smaller decline of 1.36% for the Sensex. <BR><BR>Despite a notable increase in investor participation, with delivery volume rising by 194.68% against the 5-day average, the overall trend remains negative as the stock is trading lower than its 20-day, 50-day, 100-day, and 200-day moving averages. This combination of factors contributes to the current downward movement in Ecoplast Ltd's stock price.

View full answer
iScoreScore
Click here to find our call on this stock
Strong Sell
Sell
Hold
Buy
Strong Buy

Dashboard

1

Poor long term growth as Net Sales has grown by an annual rate of 13.49% over the last 5 years

 
2

Flat results in Dec 25

3

With ROE of 10.5, it has a Expensive valuation with a 2 Price to Book Value

4

Underperformed the market in the last 1 year

stock-summaryMojo Parameters

Mojo Parameters

Loading Valuation Snapshot...

Stock DNA

stock-summary
Industry

Plastic Products - Industrial

stock-summary
Market cap

INR 151 Cr (Micro Cap)

stock-summary
P/E

21.00

stock-summary
Industry P/E

17

stock-summary
Dividend Yield

0.00%

stock-summary
Debt Equity

-0.14

stock-summary
Return on Equity

10.49%

stock-summary
Price to Book

1.95

Revenue and Profits:
Net Sales:
36 Cr
(Quarterly Results - Dec 2025)
Net Profit:
1 Cr
stock-summaryTotal Returns
Total Returns (Price + Dividend) stock-summary
Dividend Yield (0%)
TimePeriod
Price Return
Dividend Return
Total Return
3 Months
-11.24%
0%
-11.24%
6 Months
-14.03%
0%
-14.03%
1 Year
-23.28%
0%
-23.28%
2 Years
25.34%
0.83%
26.17%
3 Years
565.16%
5.59%
570.75%
4 Years
484.48%
5.08%
489.56%
5 Years
474.37%
6.11%
480.48%

Latest dividend: 3 per share ex-dividend date: Aug-08-2024

Risk Adjusted Returns v/s stock-summary
Returns Beta
Icon
Beta has not been calculated since enough price history is not available
stock-summaryNews & Corporate Actions

News

Why is Ecoplast Ltd falling/rising?

Strong Intraday Performance and Sector Momentum

Ecoplast Ltd's shares reached an intraday high of ₹466, marking a 6.77% increase during the trading session. This outperformance is particularly striking when compared to the broader packaging sector, which itself gained 2.16% on the same day. The stock's advance exceeded the sector's rise by approximately 4.4%, signalling robust demand for Ecoplast shares relative to its peers.

Such sectoral strength often acts as a catalyst for individual stock rallies, especially when combined with company-specific factors. In this case, the packaging industry's positive momentum has likely contributed to renewed investor confidence in Ecoplast Ltd.

Investor Participation and Trading Activity

One of the k...

Read full news article
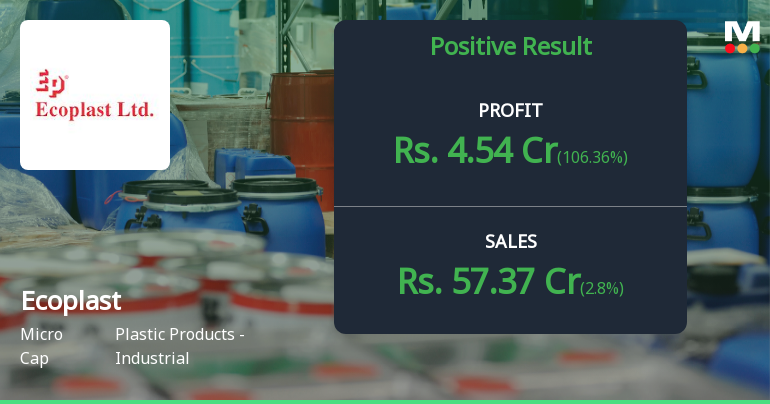
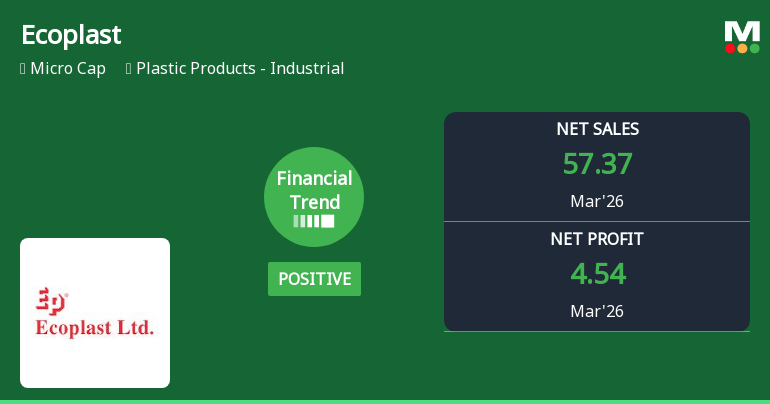
Announcements stock-summary

Shareholder Meeting / Postal Ballot-Scrutinizers Report

09-Feb-2026 | Source : BSE

Voting Results along with scrutinizer report of the remote e-voting conducted through postal ballot

Announcement under Regulation 30 (LODR)-Newspaper Publication

07-Feb-2026 | Source : BSE

Newspaper Publication for unaudited financial Results for the quarter and nine months ended December 31 2025

Board Meeting Outcome for Outcome Of Board Meeting

06-Feb-2026 | Source : BSE

attached

Corporate Actions stock-summary

stock-summary
BOARD MEETING

No Upcoming Board Meetings

stock-summary
DIVIDEND

Ecoplast Ltd has declared 30% dividend, ex-date: 08 Aug 24

stock-summary
SPLITS

No Splits history available

stock-summary
BONUS

No Bonus history available

stock-summary
RIGHTS

No Rights history available

stock-summaryKey Factors

Quality key factors stock-summary

Factor
Value
Sales Growth (5y)
13.49%
EBIT Growth (5y)
29.49%
EBIT to Interest (avg)
5.33
Debt to EBITDA (avg)
2.43
Net Debt to Equity (avg)
-0.14
Sales to Capital Employed (avg)
2.43
Tax Ratio
28.61%
Dividend Payout Ratio
12.25%
Pledged Shares
0
Institutional Holding
0
ROCE (avg)
12.85%
ROE (avg)
11.45%

Valuation key factors

Factor
Value
P/E Ratio
21
Industry P/E
17
Price to Book Value
2.05
EV to EBIT
18.23
EV to EBITDA
12.45
EV to Capital Employed
2.23
EV to Sales
1.08
PEG Ratio
NA
Dividend Yield
NA
ROCE (Latest)
13.53%
ROE (Latest)
10.49%

Technicals key factors

Indicator
Weekly
Monthly
MACD
Bearish
Mildly Bearish
RSI
No Signal
No Signal
Bollinger Bands
Mildly Bearish
Mildly Bearish
Moving Averages
Bearish (Daily)
KST
Bearish
Mildly Bearish
Dow Theory
No Trend
No Trend
stock-summary Technical Indicator Scale: Bearish, Mildly Bearish, Sideways, Mildly Bullish, Bullish  Turned 
stock-summaryShareholding
Shareholding Snapshot : Dec 2025stock-summary
Shareholding Compare (%holding) stock-summary
Majority shareholders

Promoters

Pledged Promoter Holdings

None

Mutual Funds

Held by 0 Schemes

FIIs

Held by 0 FIIs

Promoter with highest holding

Amita Jaymin Desai (17.11%)

Highest Public shareholder

Anil Kumar Goel (1.85%)

Individual Investors Holdings

28.46%

stock-summaryFinancial
[
  {
    "link": "quarterly",
    "btn_text": "All Quarterly Results",
    "header": "Quarterly Results Snapshot (Consolidated) - Dec'25 - QoQ",
    "rhs": [
      {
        "prefix": "Net Sales ",
        "suffix": "QoQ Growth in quarter ended Dec 2025 is 0.95% vs 4.08% in Sep 2025",
        "dir": -1
      },
      {
        "prefix": "Consolidated Net Profit ",
        "suffix": "QoQ Growth in quarter ended Dec 2025 is -30.20% vs -2.88% in Sep 2025",
        "dir": -1
      }
    ],
    "table": {
      "header": [
        "Dec'25",
        "Sep'25",
        "Change(%)"
      ],
      "body": [
        {
          "field": "Net Sales",
          "val1": "36.07",
          "val2": "35.73",
          "chgp": "0.95%",
          "chgp_class": "positive"
        },
        {
          "field": "Operating Profit (PBDIT) excl Other Income",
          "val1": "2.60",
          "val2": "3.18",
          "chgp": "-18.24%",
          "chgp_class": "negative"
        },
        {
          "field": "Interest",
          "val1": "0.16",
          "val2": "0.15",
          "chgp": "6.67%",
          "chgp_class": "negative"
        },
        {
          "field": "Exceptional Items",
          "val1": "0.00",
          "val2": "0.00",
          "chgp": "",
          "chgp_class": "neutral"
        },
        {
          "field": "Consolidate Net Profit",
          "val1": "1.41",
          "val2": "2.02",
          "chgp": "-30.20%",
          "chgp_class": "negative"
        },
        {
          "field": "Operating Profit Margin (Excl OI)",
          "val1": "7.21%",
          "val2": "8.90%",
          "chgp": "-1.69%",
          "chgp_class": "negative"
        }
      ]
    }
  },
  {
    "link": "half-yearly",
    "btn_text": "All Half Yearly Results",
    "header": "Half Yearly Results Snapshot (Consolidated) - Sep'25",
    "rhs": [
      {
        "prefix": "Net Sales ",
        "suffix": " Growth in half year ended Sep 2025 is 15.34% vs 9.72% in Sep 2024",
        "dir": 1
      },
      {
        "prefix": "Consolidated Net Profit ",
        "suffix": " Growth in half year ended Sep 2025 is -5.31% vs -5.66% in Sep 2024",
        "dir": 1
      }
    ],
    "table": {
      "header": [
        "Sep'25",
        "Sep'24",
        "Change(%)"
      ],
      "body": [
        {
          "field": "Net Sales",
          "val1": "70.07",
          "val2": "60.75",
          "chgp": "15.34%",
          "chgp_class": "positive"
        },
        {
          "field": "Operating Profit (PBDIT) excl Other Income",
          "val1": "6.08",
          "val2": "5.58",
          "chgp": "8.96%",
          "chgp_class": "positive"
        },
        {
          "field": "Interest",
          "val1": "0.25",
          "val2": "0.15",
          "chgp": "66.67%",
          "chgp_class": "negative"
        },
        {
          "field": "Exceptional Items",
          "val1": "0.00",
          "val2": "0.00",
          "chgp": "",
          "chgp_class": "neutral"
        },
        {
          "field": "Consolidate Net Profit",
          "val1": "4.10",
          "val2": "4.33",
          "chgp": "-5.31%",
          "chgp_class": "negative"
        },
        {
          "field": "Operating Profit Margin (Excl OI)",
          "val1": "8.68%",
          "val2": "9.19%",
          "chgp": "-0.51%",
          "chgp_class": "negative"
        }
      ]
    }
  },
  {
    "link": "nine-monthly",
    "btn_text": "All Nine Monthly Results",
    "header": "Nine Monthly Results Snapshot (Consolidated) - Dec'25",
    "rhs": [
      {
        "prefix": "Net Sales ",
        "suffix": "YoY Growth in nine months ended Dec 2025 is 12.75% vs 12.38% in Dec 2024",
        "dir": 1
      },
      {
        "prefix": "Consolidated Net Profit ",
        "suffix": "YoY Growth in nine months ended Dec 2025 is -14.57% vs 0.16% in Dec 2024",
        "dir": -1
      }
    ],
    "table": {
      "header": [
        "Dec'25",
        "Dec'24",
        "Change(%)"
      ],
      "body": [
        {
          "field": "Net Sales",
          "val1": "106.14",
          "val2": "94.14",
          "chgp": "12.75%",
          "chgp_class": "positive"
        },
        {
          "field": "Operating Profit (PBDIT) excl Other Income",
          "val1": "8.68",
          "val2": "8.96",
          "chgp": "-3.13%",
          "chgp_class": "negative"
        },
        {
          "field": "Interest",
          "val1": "0.41",
          "val2": "0.23",
          "chgp": "78.26%",
          "chgp_class": "negative"
        },
        {
          "field": "Exceptional Items",
          "val1": "0.00",
          "val2": "0.00",
          "chgp": "",
          "chgp_class": "neutral"
        },
        {
          "field": "Consolidate Net Profit",
          "val1": "5.51",
          "val2": "6.45",
          "chgp": "-14.57%",
          "chgp_class": "negative"
        },
        {
          "field": "Operating Profit Margin (Excl OI)",
          "val1": "8.18%",
          "val2": "9.52%",
          "chgp": "-1.34%",
          "chgp_class": "negative"
        }
      ]
    }
  },
  {
    "link": "annual",
    "btn_text": "All Annual Results",
    "header": "Annual Results Snapshot (Consolidated) - Mar'25",
    "rhs": [
      {
        "prefix": "Net Sales ",
        "suffix": "YoY Growth in year ended Mar 2025 is 11.59% vs 17.88% in Mar 2024",
        "dir": -1
      },
      {
        "prefix": "Consolidated Net Profit ",
        "suffix": "YoY Growth in year ended Mar 2025 is -7.74% vs 106.07% in Mar 2024",
        "dir": -1
      }
    ],
    "table": {
      "header": [
        "Mar'25",
        "Mar'24",
        "Change(%)"
      ],
      "body": [
        {
          "field": "Net Sales",
          "val1": "126.59",
          "val2": "113.44",
          "chgp": "11.59%",
          "chgp_class": "positive"
        },
        {
          "field": "Operating Profit (PBDIT) excl Other Income",
          "val1": "12.27",
          "val2": "12.97",
          "chgp": "-5.40%",
          "chgp_class": "negative"
        },
        {
          "field": "Interest",
          "val1": "0.40",
          "val2": "0.34",
          "chgp": "17.65%",
          "chgp_class": "negative"
        },
        {
          "field": "Exceptional Items",
          "val1": "0.00",
          "val2": "0.00",
          "chgp": "",
          "chgp_class": "neutral"
        },
        {
          "field": "Consolidate Net Profit",
          "val1": "8.46",
          "val2": "9.17",
          "chgp": "-7.74%",
          "chgp_class": "negative"
        },
        {
          "field": "Operating Profit Margin (Excl OI)",
          "val1": "9.69%",
          "val2": "11.43%",
          "chgp": "-1.74%",
          "chgp_class": "negative"
        }
      ]
    }
  }
]

Quarterly Results Snapshot (Consolidated) - Dec'25 - QoQstock-summary

Dec'25
Sep'25
Change(%)
Net Sales
36.07
35.73
0.95%
Operating Profit (PBDIT) excl Other Income
2.60
3.18
-18.24%
Interest
0.16
0.15
6.67%
Exceptional Items
0.00
0.00
Consolidate Net Profit
1.41
2.02
-30.20%
Operating Profit Margin (Excl OI)
7.21%
8.90%
-1.69%
Values in Rs Cr.
Direction Arrows
Net Sales

QoQ Growth in quarter ended Dec 2025 is 0.95% vs 4.08% in Sep 2025

Direction Arrows
Consolidated Net Profit

QoQ Growth in quarter ended Dec 2025 is -30.20% vs -2.88% in Sep 2025

Half Yearly Results Snapshot (Consolidated) - Sep'25stock-summary

Sep'25
Sep'24
Change(%)
Net Sales
70.07
60.75
15.34%
Operating Profit (PBDIT) excl Other Income
6.08
5.58
8.96%
Interest
0.25
0.15
66.67%
Exceptional Items
0.00
0.00
Consolidate Net Profit
4.10
4.33
-5.31%
Operating Profit Margin (Excl OI)
8.68%
9.19%
-0.51%
Values in Rs Cr.
Direction Arrows
Net Sales

Growth in half year ended Sep 2025 is 15.34% vs 9.72% in Sep 2024

Direction Arrows
Consolidated Net Profit

Growth in half year ended Sep 2025 is -5.31% vs -5.66% in Sep 2024

Nine Monthly Results Snapshot (Consolidated) - Dec'25stock-summary

Dec'25
Dec'24
Change(%)
Net Sales
106.14
94.14
12.75%
Operating Profit (PBDIT) excl Other Income
8.68
8.96
-3.13%
Interest
0.41
0.23
78.26%
Exceptional Items
0.00
0.00
Consolidate Net Profit
5.51
6.45
-14.57%
Operating Profit Margin (Excl OI)
8.18%
9.52%
-1.34%
Values in Rs Cr.
Direction Arrows
Net Sales

YoY Growth in nine months ended Dec 2025 is 12.75% vs 12.38% in Dec 2024

Direction Arrows
Consolidated Net Profit

YoY Growth in nine months ended Dec 2025 is -14.57% vs 0.16% in Dec 2024

Annual Results Snapshot (Consolidated) - Mar'25stock-summary

Mar'25
Mar'24
Change(%)
Net Sales
126.59
113.44
11.59%
Operating Profit (PBDIT) excl Other Income
12.27
12.97
-5.40%
Interest
0.40
0.34
17.65%
Exceptional Items
0.00
0.00
Consolidate Net Profit
8.46
9.17
-7.74%
Operating Profit Margin (Excl OI)
9.69%
11.43%
-1.74%
Values in Rs Cr.
Direction Arrows
Net Sales

YoY Growth in year ended Mar 2025 is 11.59% vs 17.88% in Mar 2024

Direction Arrows
Consolidated Net Profit

YoY Growth in year ended Mar 2025 is -7.74% vs 106.07% in Mar 2024

stock-summaryCompany CV
About Ecoplast Ltd stock-summary
stock-summary
Ecoplast Ltd
Micro Cap
Plastic Products - Industrial
Ecoplast Limited is one of India's reputed suppliers of multilayer co-extruded polyethylene and copolymer films to the flexible packaging industry as well as a variety of other Industrial Applications around the world. The major focus now is high value added products and films for Specialty Applications for flexible packaging applications. Currently, the Company serve applications in Film for Aluminum Composite Panel, Films for Surface Protection and FMCG and Pharma Packaging.
Company Coordinates stock-summary
Company Details
No 8 National Highway, Water Works Cross Road Abrama Valsad Gujarat : 396002
stock-summary
Tel: 91-2632-254137/254153/249190
stock-summary
ecoval@ecoplastindia.com
Registrar Details
TSR Darashaw Ltd, 6-10 , Haji Moosa Patrawala Indl. Est , 20 Dr.E.Moses Road , Mahalaxmi , Mumbai