
Compare Ecos (India) with Similar Stocks
Dashboard
High Management Efficiency with a high ROE of 24.42%
The company is Net-Debt Free
Healthy long term growth as Net Sales has grown by an annual rate of 52.80% and Operating profit at 67.72%
Flat results in Mar 26
With ROE of 21.7, it has a Very Attractive valuation with a 3.1 Price to Book Value
Falling Participation by Institutional Investors
Below par performance in long term as well as near term
Stock DNA
Transport Services
INR 816 Cr (Micro Cap)
14.00
36
1.77%
-0.49
21.73%
3.07
Total Returns (Price + Dividend) 
Latest dividend: 2.4 per share ex-dividend date: Aug-20-2025
Risk Adjusted Returns v/s
Returns Beta

News

Ecos (India) Mobility & Hospitality Ltd Shows Mixed Technical Signals Amid Price Momentum Shift
Ecos (India) Mobility & Hospitality Ltd has experienced a notable shift in its technical parameters, moving from a mildly bearish trend to a sideways momentum. Despite a modest day gain of 2.30%, the stock’s technical indicators present a complex picture, with some signals pointing to cautious optimism while others suggest lingering weakness. This analysis delves into the recent price momentum, key technical indicators, and the broader market context to provide a comprehensive view for investors.
Read full news article
Ecos (India) Mobility & Hospitality Ltd is Rated Hold
Ecos (India) Mobility & Hospitality Ltd is rated 'Hold' by MarketsMOJO, with this rating last updated on 04 May 2026. However, the analysis and financial metrics discussed below reflect the stock's current position as of 26 July 2026, providing investors with the latest insights into its performance and outlook.
Read full news article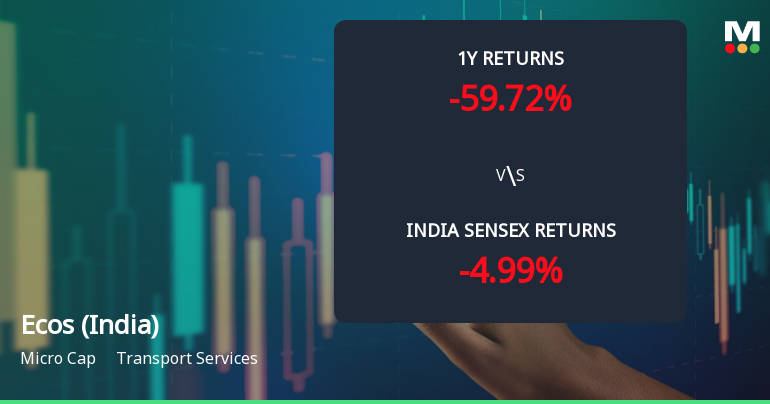
Ecos (India) Mobility & Hospitality Ltd: Technical Momentum Shifts Amid Bearish Trends
Ecos (India) Mobility & Hospitality Ltd, a micro-cap player in the transport services sector, has experienced a notable shift in its technical momentum, moving from a sideways trend to a mildly bearish stance. Despite a recent upgrade in its Mojo Grade from Sell to Hold, the stock’s price action and technical indicators reveal a complex picture that investors should carefully analyse before making decisions.
Read full news article Announcements
Corporate Actions

11 Aug 2026

Ecos (India) Mobility & Hospitality Ltd has declared 120% dividend, ex-date: 20 Aug 25

No Splits history available

No Bonus history available

No Rights history available
Quality key factors
Valuation key factors
Technicals key factors
 Technical Indicator Scale: Bearish, Mildly Bearish, Sideways, Mildly Bullish, Bullish Turned
 Shareholding Snapshot : Jun 2026
Shareholding Compare (%holding)
Promoters
None
Held by 1 Schemes (9.92%)
Held by 9 FIIs (1.01%)
Rajesh Loomba (32.28%)
Bandhan Large & Mid Cap Fund (9.92%)
16.62%
Quarterly Results Snapshot (Consolidated) - Mar'26 - QoQ

QoQ Growth in quarter ended Mar 2026 is 0.33% vs -3.80% in Dec 2025
QoQ Growth in quarter ended Mar 2026 is 12.91% vs -4.59% in Dec 2025
Half Yearly Results Snapshot (Consolidated) - Sep'25
Growth in half year ended Sep 2025 is 28.15% vs 14.89% in Sep 2024

Growth in half year ended Sep 2025 is -4.62% vs -3.81% in Sep 2024
Nine Monthly Results Snapshot (Consolidated) - Dec'25
YoY Growth in nine months ended Dec 2025 is 26.15% vs 17.59% in Dec 2024
YoY Growth in nine months ended Dec 2025 is -0.45% vs -5.68% in Dec 2024
Annual Results Snapshot (Consolidated) - Mar'26
YoY Growth in year ended Mar 2026 is 23.58% vs 17.96% in Mar 2025
YoY Growth in year ended Mar 2026 is -4.19% vs -3.89% in Mar 2025
About Ecos (India) Mobility & Hospitality Ltd

Company Coordinates


