
Compare Edelweiss.Fin. with Similar Stocks
Stock DNA
Holding Company
INR 10,152 Cr (Small Cap)
17.00
20
1.42%
4.02
12.55%
2.17
Total Returns (Price + Dividend) 
Latest dividend: 1.5 per share ex-dividend date: Sep-11-2025
Risk Adjusted Returns v/s
Returns Beta

News

Edelweiss Financial Services Downgraded to Sell Amid Technical and Financial Concerns
Edelweiss Financial Services Ltd has been downgraded from a Hold to a Sell rating, reflecting a combination of deteriorating technical indicators, flat financial performance, and valuation concerns amid a challenging market environment. The downgrade, effective from 11 June 2026, follows a comprehensive reassessment across four key parameters: Quality, Valuation, Financial Trend, and Technicals.
Read full news article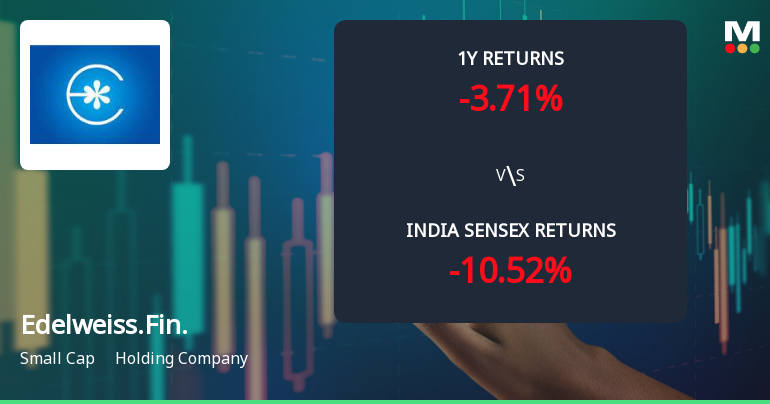
Edelweiss Financial Services Ltd Faces Technical Momentum Shift Amid Mixed Indicators
Edelweiss Financial Services Ltd (NSE: 477559) has experienced a notable shift in its technical momentum, transitioning from a mildly bullish stance to a sideways trend. This change is underscored by a combination of bearish signals on weekly and monthly charts, alongside mixed readings from key technical indicators such as MACD, RSI, Bollinger Bands, and moving averages. The company’s recent downgrade from a Hold to a Sell rating by MarketsMOJO further reflects growing caution among analysts amid subdued price action and relative underperformance against benchmark indices.
Read full news article
Edelweiss Financial Services Ltd is Rated Hold
Edelweiss Financial Services Ltd is rated 'Hold' by MarketsMOJO, with this rating last updated on 21 April 2026. However, the analysis and financial metrics discussed below reflect the stock's current position as of 08 June 2026, providing investors with an up-to-date view of its performance and prospects.
Read full news article Announcements
Press Release
08-Jun-2026 | Source : BSEEnclosed is the press release titled Edelweiss Financial Services Limited announces ?3000 million Public Issue of Secured Redeemable Non-Convertible Debentures (NCDs).
Public Issue Of Non-Convertible Debentures
01-Jun-2026 | Source : BSEPublic issue of Non-convertible Debentures
Grant Of Stock Appreciation Rights
28-May-2026 | Source : BSEGrant Of Stock Appreciation Rights
Corporate Actions

No Upcoming Board Meetings

Edelweiss Financial Services Ltd has declared 150% dividend, ex-date: 11 Sep 25

Edelweiss Financial Services Ltd has announced 1:5 stock split, ex-date: 10 Aug 10

Edelweiss Financial Services Ltd has announced 1:1 bonus issue, ex-date: 10 Aug 10

No Rights history available
Quality key factors
Valuation key factors
Technicals key factors
 Technical Indicator Scale: Bearish, Mildly Bearish, Sideways, Mildly Bullish, Bullish Turned
 Shareholding Snapshot : Mar 2026
Shareholding Compare (%holding)
Non Institution
8.8979
Held by 9 Schemes (1.01%)
Held by 146 FIIs (19.04%)
Rashesh Chandrakant Shah (15.38%)
Life Insurance Corporation Of India (2.57%)
29.71%
Quarterly Results Snapshot (Consolidated) - Mar'26 - YoY

YoY Growth in quarter ended Mar 2026 is -15.88% vs -22.09% in Mar 2025
YoY Growth in quarter ended Mar 2026 is -16.84% vs -37.71% in Mar 2025
Half Yearly Results Snapshot (Consolidated) - Sep'25

Growth in half year ended Sep 2025 is -19.30% vs 23.08% in Sep 2024
Growth in half year ended Sep 2025 is 15.41% vs 33.70% in Sep 2024
Nine Monthly Results Snapshot (Consolidated) - Dec'25
YoY Growth in nine months ended Dec 2025 is 21.76% vs 6.95% in Dec 2024
YoY Growth in nine months ended Dec 2025 is 56.40% vs 16.66% in Dec 2024
Annual Results Snapshot (Consolidated) - Mar'26
YoY Growth in year ended Mar 2026 is 12.61% vs -0.68% in Mar 2025
YoY Growth in year ended Mar 2026 is 37.06% vs -5.20% in Mar 2025
About Edelweiss Financial Services Ltd

Company Coordinates


