
Compare Edible Garden AG , Inc. with Similar Stocks
Dashboard
With a Operating Losses, the company has a Weak Long Term Fundamental Strength
- Poor long term growth as Operating profit has grown by an annual rate -242.34% of over the last 5 years
- Company's ability to service its debt is weak with a poor EBIT to Interest (avg) ratio of -5.34
- OPERATING CASH FLOW(Y) Lowest at USD -9.63 MM
- INTEREST(HY) At USD 0.83 MM has Grown at 54.66%
- INVENTORY TURNOVER RATIO(HY) Lowest at 9.64 times
Risky - Negative EBITDA
Underperformed the market in the last 1 year
Stock DNA
Other Agricultural Products
USD 3 Million (Micro Cap)
NA (Loss Making)
NA
0.00%
0.13
-109.98%
0.23
Total Returns (Price + Dividend) 
Edible Garden AG , Inc. for the last several years.
Risk Adjusted Returns v/s
News
Edible Garden AG, Inc. Hits New 52-Week Low at $1.04
Edible Garden AG, Inc. has reached a new 52-week low, reflecting a challenging year marked by a significant stock price decline. The company faces ongoing financial difficulties, including negative return on equity, high operating losses, and low inventory turnover, indicating operational inefficiencies and a precarious financial position.
Read full news article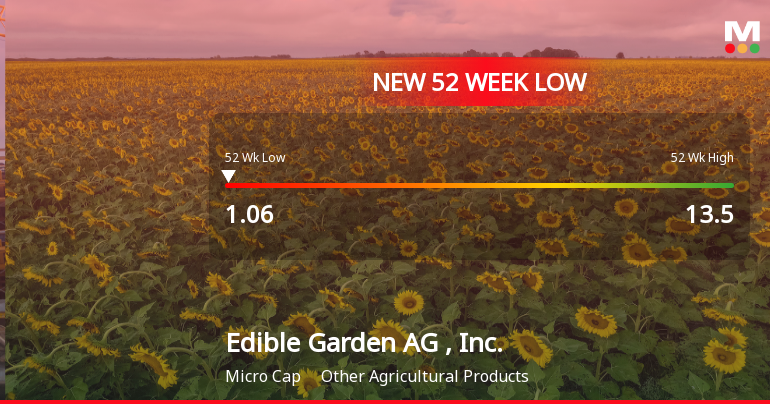
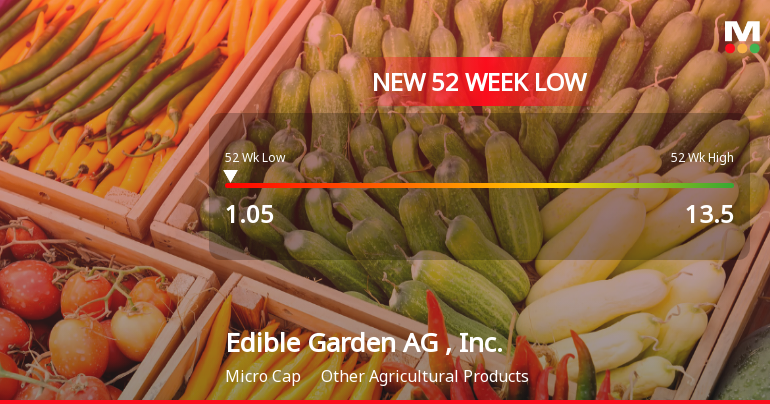
Edible Garden AG, Inc. Hits New 52-Week Low at $1.05
Edible Garden AG, Inc. has reached a new 52-week low, reflecting a challenging year with a significant stock price decline. The company faces ongoing financial difficulties, including a negative return on equity and an alarming drop in operating profit, raising concerns about its ability to manage debt and ensure long-term viability.
Read full news article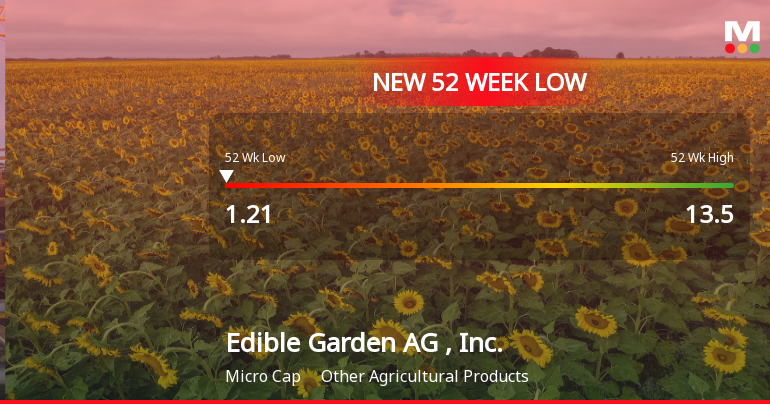
Edible Garden AG, Inc. Hits New 52-Week Low at $1.21
Edible Garden AG, Inc. has reached a new 52-week low, reflecting ongoing struggles with a one-year performance decline of 29.24%. The company, with a market capitalization of USD 5 million, has not reported earnings and faces significant financial challenges, including negative operating cash flow and a steep decline in annual operating profit.
Read full news article Announcements

Corporate Actions
Quality key factors
Valuation key factors
Technicals key factors
 Technical Indicator Scale: Bearish, Mildly Bearish, Sideways, Mildly Bullish, Bullish Turned
 Shareholding Snapshot : Sep 2025
Shareholding Compare (%holding)
Domestic Funds
Held in 2 Schemes (0.52%)
Held by 4 Foreign Institutions (0.14%)
Quarterly Results Snapshot (Consolidated) - Sep'25 - YoY

YoY Growth in quarter ended Sep 2025 is 7.69% vs -21.21% in Sep 2024

YoY Growth in quarter ended Sep 2025 is -90.48% vs 12.50% in Sep 2024
Annual Results Snapshot (Consolidated) - Dec'24
YoY Growth in year ended Dec 2024 is -0.71% vs 20.69% in Dec 2023
YoY Growth in year ended Dec 2024 is -8.82% vs 18.40% in Dec 2023
About Edible Garden AG , Inc.

Company Coordinates


