
Dashboard
With a Operating Losses, the company has a Weak Long Term Fundamental Strength
- Poor long term growth as Operating profit has grown by an annual rate -192.23% of over the last 5 years
- High Debt Company with a Debt to Equity ratio (avg) at times
Negative results in Jun 25
Risky - Negative EBITDA
Stock DNA
Software Products
USD 137 Million (Micro Cap)
NA (Loss Making)
NA
0.00%
3.47
-111.39%
15.41
Total Returns (Price + Dividend) 
Eightco Holdings, Inc. for the last several years.
Risk Adjusted Returns v/s
News
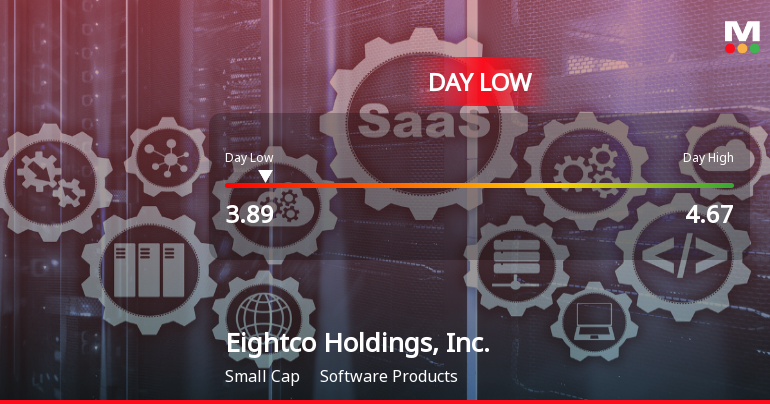
Eightco Holdings Hits Day Low of $3.88 Amid Price Pressure
Eightco Holdings, Inc. has faced a notable decline in its stock price, with a significant drop on November 10, 2025. Despite a remarkable annual return, the company struggles with high debt levels and negative EBITDA, indicating potential challenges in its market position and long-term performance.
Read MoreIs Eightco Holdings, Inc. technically bullish or bearish?
As of 8 September 2025, the technical trend for Eightco Holdings, Inc. has changed from sideways to bullish. The current stance is bullish, driven by a daily bullish moving average and a weekly bullish MACD. However, the weekly and monthly RSI readings are bearish, indicating some weakness in momentum. The Bollinger Bands show a mildly bullish trend on the weekly and a bullish trend on the monthly, while the Dow Theory indicates a mildly bullish stance across both time frames. In terms of performance, the stock has returned 714.94% over the past month compared to a 2.33% return for the S&P 500, but it has underperformed over longer periods, with a 1-year return of 497.62% against 17.14% for the benchmark....
Read MoreIs Eightco Holdings, Inc. overvalued or undervalued?
As of 15 May 2025, the valuation grade for Eightco Holdings, Inc. has moved from fair to risky, indicating a deterioration in its financial outlook. The company appears to be overvalued given its significant negative valuation metrics, including a Price to Book Value of 0.42, an EV to EBIT of -5.22, and an EV to EBITDA of -8.28. In comparison to peers, Eightco Holdings has a P/E ratio of -13.83, which is less favorable than Verb Technology Co., Inc. at -51.90 and Marpai, Inc. at -1.66, both of which also reflect a risky valuation. Despite impressive short-term returns, with a 1-month return of 714.94% compared to the S&P 500's 2.33%, the long-term performance is concerning, as evidenced by a 3-year return of -93.22% against the S&P 500's 70.41%. This stark contrast highlights the potential risks associated with investing in Eightco Holdings at its current valuation....
Read More Announcements

Corporate Actions
Quality key factors
Valuation key factors
Technicals key factors
 Technical Indicator Scale: Bearish, Mildly Bearish, Sideways, Mildly Bullish, Bullish Turned
 Shareholding Snapshot : Mar 2025
Shareholding Compare (%holding)
Domestic Funds
Held in 3 Schemes (1.94%)
Held by 7 Foreign Institutions (0.3%)
Quarterly Results Snapshot (Consolidated) - Jun'25 - YoY

YoY Growth in quarter ended Jun 2025 is 8.57% vs -65.85% in Jun 2024

YoY Growth in quarter ended Jun 2025 is -127.27% vs 149.44% in Jun 2024
Annual Results Snapshot (Consolidated) - Dec'24
YoY Growth in year ended Dec 2024 is -47.41% vs 136.79% in Dec 2023
YoY Growth in year ended Dec 2024 is 100.44% vs -44.09% in Dec 2023
About Eightco Holdings, Inc.

Company Coordinates


