
Compare EIH with Similar Stocks
Stock DNA
Hotels & Resorts
INR 18,286 Cr (Small Cap)
25.00
34
0.52%
-0.16
13.66%
3.46
Total Returns (Price + Dividend) 
Latest dividend: 1.5 per share ex-dividend date: Jul-30-2025
Risk Adjusted Returns v/s
Returns Beta

News

EIH Ltd. is Rated Sell by MarketsMOJO
EIH Ltd. is rated 'Sell' by MarketsMOJO, with this rating last updated on 27 April 2026. However, the analysis and financial metrics discussed here reflect the stock’s current position as of 11 June 2026, providing investors with the latest insights into the company’s performance and outlook.
Read full news article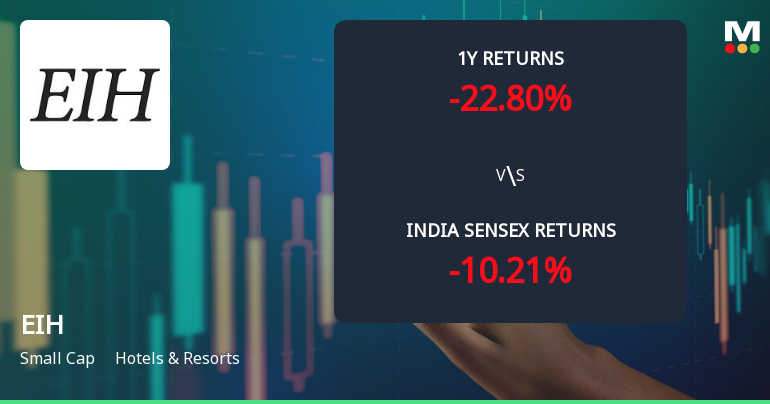
EIH Ltd. Technical Momentum Shifts Amid Bearish Signals
EIH Ltd., a small-cap player in the Hotels & Resorts sector, has experienced a notable shift in its technical momentum, with key indicators signalling a bearish trend. Despite a modest day gain of 0.41%, the stock’s technical parameters reveal a deteriorating outlook, prompting a downgrade in its Mojo Grade from Hold to Sell as of 27 April 2026.
Read full news article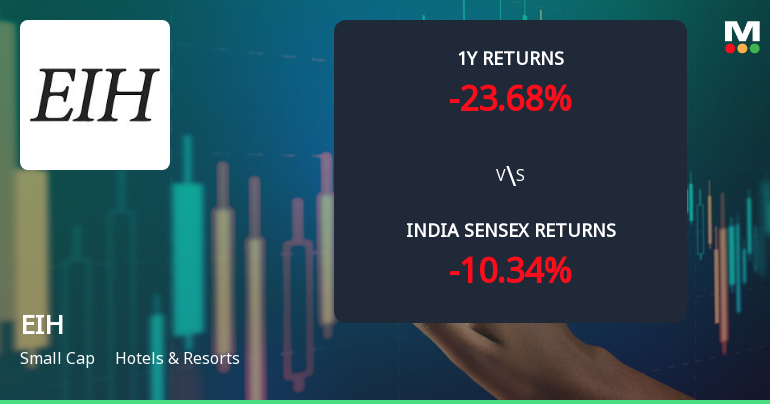
EIH Ltd. Technical Momentum Shifts Amid Mixed Market Signals
EIH Ltd., a small-cap player in the Hotels & Resorts sector, has experienced a subtle shift in its technical momentum, moving from a bearish to a mildly bearish trend. Despite a recent day gain of 1.92%, the stock’s broader technical indicators present a complex picture, with mixed signals from MACD, RSI, moving averages, and other momentum oscillators. This analysis delves into the evolving technical landscape of EIH Ltd., contextualising its price action against sectoral and benchmark returns.
Read full news article Announcements
EIH Limited - Updates
06-Nov-2019 | Source : NSEEIH Limited has informed the Exchange regarding 'Disclosure under Regulation 30 of SEBI (Listing Obligations and Disclosure
EIH Limited - Analysts/Institutional Investor Meet/Con. Call Updates
04-Nov-2019 | Source : NSEEIH Limited has informed the Exchange regarding Analysts/Institutional Investor Meet/Con. Call Updates
Shareholders meeting
11-Sep-2019 | Source : NSE
| EIH Limited has informed the Exchange regarding Notice of Postal Ballot |
Corporate Actions

No Upcoming Board Meetings

EIH Ltd. has declared 75% dividend, ex-date: 31 Jul 26

EIH Ltd. has announced 2:10 stock split, ex-date: 12 Sep 06

EIH Ltd. has announced 1:2 bonus issue, ex-date: 12 Sep 06

EIH Ltd. has announced 8:85 rights issue, ex-date: 22 Sep 20
Quality key factors
Valuation key factors
Technicals key factors
 Technical Indicator Scale: Bearish, Mildly Bearish, Sideways, Mildly Bullish, Bullish Turned
 Shareholding Snapshot : Mar 2026
Shareholding Compare (%holding)
Non Institution
None
Held by 22 Schemes (12.81%)
Held by 121 FIIs (6.62%)
Oberoi Hotels Private Limited (17.67%)
Reliance Strategic Business Ventures Limited (18.83%)
9.72%
Quarterly Results Snapshot (Consolidated) - Mar'26 - YoY

YoY Growth in quarter ended Mar 2026 is 8.19% vs 11.62% in Mar 2025
YoY Growth in quarter ended Mar 2026 is -6.06% vs 13.46% in Mar 2025
Half Yearly Results Snapshot (Consolidated) - Sep'25
Growth in half year ended Sep 2025 is 5.02% vs 8.44% in Sep 2024
Growth in half year ended Sep 2025 is -33.52% vs 12.80% in Sep 2024
Nine Monthly Results Snapshot (Consolidated) - Dec'25
YoY Growth in nine months ended Dec 2025 is 6.72% vs 8.24% in Dec 2024
YoY Growth in nine months ended Dec 2025 is -19.70% vs 16.90% in Dec 2024
Annual Results Snapshot (Consolidated) - Mar'26
YoY Growth in year ended Mar 2026 is 7.16% vs 9.23% in Mar 2025
YoY Growth in year ended Mar 2026 is -15.03% vs 15.70% in Mar 2025
About EIH Ltd.

Company Coordinates


