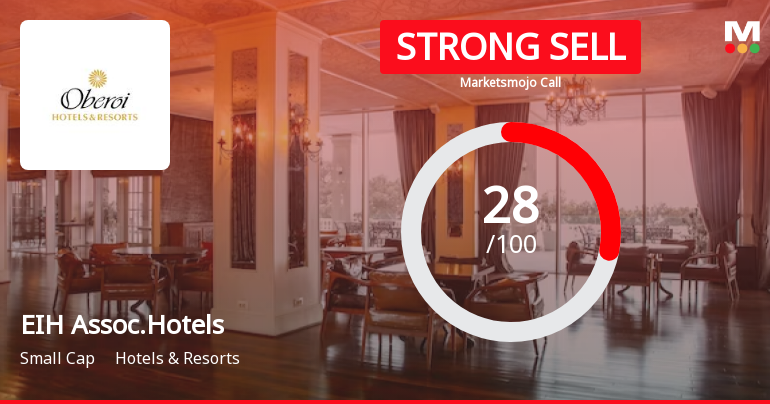
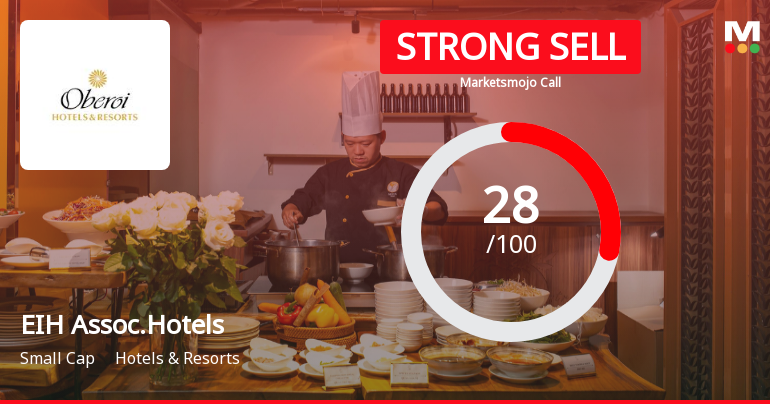
EIH Assoc.Hotels

  • Market Cap: Small Cap
  • Industry: Hotels & Resorts
  • ISIN: INE276C01014
  • NSEID: EIHAHOTELS
  • BSEID: 523127
INR
300.95
-0.85 (-0.28%)
BSENSE

Aug 31, 10:33 AM

BSE+NSE Vol: 3.79 k

  • Price Points
  • Score
  • Mojo Parameters
  • Total Return
  • News and Corporate Actions
  • Key factors
  • Shareholding
  • Financials
  • CompanyCV
stock-summaryPrice Point
High/Low

1Day

52 Week

Valuation
Technical
Day's Volume

CASH

3.79 k (11.31%) Volume

Shareholding (Jun 2026)

FII

13.64%

Held by 30 FIIs

DII

0.00%

Held by 1 DIIs

Promoter

75.00%

Why is EIH Associated Hotels Ltd falling/rising?

31-Aug-2026

As of 30-Aug, EIH Associated Hotels Ltd's stock price is at 302.00, showing a slight decline and a trend reversal after four days of gains, attributed to decreased investor participation and a significant drop in delivery volume. Despite outperforming its sector today, the stock has underperformed over the past year with a return of -20.25% and negative quarterly results, indicating a lack of confidence in its valuation.

As of 30-Aug, EIH Associated Hotels Ltd's stock price is currently at 302.00, reflecting a slight decline of -0.1 (-0.03%). The stock has shown a trend reversal, having fallen after four consecutive days of gains. This recent decline may be attributed to a decrease in investor participation, as evidenced by a significant drop in delivery volume, which fell by -35.56% against the 5-day average.<BR><BR>In terms of performance, while the stock outperformed its sector today by 1.43%, it has faced challenges in the longer term. Over the past year, the stock has generated a return of -20.25%, and its profits have decreased by -9%. Additionally, the company reported negative results for the quarter ending June 26, with net sales falling by -31.2% compared to the previous four-quarter average, and a drastic decline in profit before tax and profit after tax, which fell by -89.8% and -69.4%, respectively.<BR><BR>Despite being net-debt free and having healthy long-term growth in net sales and operating profit, the stock's overall performance has been below par, underperforming the BSE500 index over various time frames. Furthermore, the absence of domestic mutual fund investment, which stands at 0%, may indicate a lack of confidence in the stock's valuation or business prospects. These factors collectively contribute to the stock's current downward movement.

View full answer

Who are in the management team of EIH Assoc.Hotels?

14-Aug-2026

The management team of EIH Assoc. Hotels includes Vikram Oberoi (Managing Director), Arjun Singh Oberoi (Chairman), and several independent directors: Anil Nehru, Sudipto Sarkar, Radhika Haribhakti, and Surin Shailesh Kapadia, along with Akshay Raheja (Director) and Tejasvi Dixit (Company Secretary & Compliance Officer). They oversee the company's operations and strategic direction.

The management team of EIH Assoc. Hotels includes the following members:<BR><BR>1. **Vikram Oberoi** - Managing Director<BR>2. **Anil Nehru** - Independent Director<BR>3. **Sudipto Sarkar** - Independent Director<BR>4. **Radhika Haribhakti** - Independent Director<BR>5. **Akshay Raheja** - Director<BR>6. **Surin Shailesh Kapadia** - Independent Director<BR>7. **Tejasvi Dixit** - Company Secretary & Compliance Officer<BR>8. **Arjun Singh Oberoi** - Chairman<BR><BR>This team is responsible for overseeing the operations and strategic direction of the company. If you need more specific information about any of the members or their roles, feel free to ask!

View full answer

What does EIH Assoc.Hotels do?

14-Aug-2026

EIH Associated Hotels Ltd operates in the hotel and resort services industry, reporting net sales of 66 Cr and a net profit of 7 Cr for June 2026, with a market cap of INR 1,784 Cr. The company has a P/E ratio of 20.00 and a dividend yield of 1.20%.

Overview:<BR>EIH Associated Hotels Ltd operates in the hotel and resort services industry and is categorized as a small-cap company.<BR><BR>History:<BR>The company is incorporated as EIH Associated Hotels Ltd and has a wholly owned subsidiary, Island Hotel Maharaj Ltd. The latest quarterly results reported are for June 2026, showing net sales and profit figures.<BR><BR>Financial Snapshot:<BR>- Net Sales: 66 Cr (Quarterly Results - Jun 2026)<BR>- Net Profit: 7 Cr (Quarterly Results - Jun 2026)<BR>- Market-cap: INR 1,784 Cr (Small Cap)<BR><BR>Key Metrics:<BR>- P/E: 20.00<BR>- Industry P/E: 36<BR>- Dividend Yield: 1.20%<BR>- Debt Equity: -0.35<BR>- Return on Equity: 14.89%<BR>- Price to Book: 2.96<BR><BR>Contact Details:<BR>- Address: 1/24 G S T Road, Meenambakkam Chennai Tamil Nadu : 600027<BR>- Tel: 91-044-22374747<BR>- Email: invcom@tridenthotels.com/isdho@ober<BR>- Website: http://www.eihassociatedhotels.in

View full answer

Who are the peers of the EIH Assoc.Hotels?

14-Aug-2026

EIH Assoc.Hotels' peers include Samhi Hotels, Apeejay Surrend., Oriental Hotels, Brigade Hotel, TajGVK Hotels, Benares Hotels, Asian Hotels (N), Mac Charles(I), and Viceroy Hotels. EIH Assoc.Hotels has an average management risk, a 1-year return of -23.80%, and is positioned between Samhi Hotels and Benares Hotels in terms of returns.

Peers: The peers of EIH Assoc.Hotels are Samhi Hotels, Apeejay Surrend., Oriental Hotels, Brigade Hotel, TajGVK Hotels, Benares Hotels, Asian Hotels (N), Mac Charles(I), and Viceroy Hotels.<BR><BR>Quality Snapshot: Below Average management risk is observed at Samhi Hotels, Mac Charles(I), and Viceroy Hotels, while Average management risk is found at Apeejay Surrend., Brigade Hotel, TajGVK Hotels, EIH Assoc.Hotels, Benares Hotels, Asian Hotels (N), and Royal Orch.Hotel. Good growth is noted at Samhi Hotels, Oriental Hotels, EIH Assoc.Hotels, TajGVK Hotels, Benares Hotels, and Asian Hotels (N), while Excellent growth is seen at TajGVK Hotels and Benares Hotels. Excellent capital structure is present at TajGVK Hotels, EIH Assoc.Hotels, and Benares Hotels, while Good capital structure is found at Apeejay Surrend., Brigade Hotel, and Oriental Hotels, and the rest have Below Average capital structure.<BR><BR>Return Snapshot: The peer with the highest 1-year return is Benares Hotels at 10.05%, while the lowest is Samhi Hotels at -26.24%. EIH Assoc.Hotels has a 1-year return of -23.80%, which is higher than Samhi Hotels but lower than Benares Hotels. Additionally, peers with negative six-month returns include Samhi Hotels, Brigade Hotel, TajGVK Hotels, and EIH Assoc.Hotels.

View full answer

How big is EIH Assoc.Hotels?

14-Aug-2026

Summary could not be generated.

As of 14th August, <BR><BR>Market Cap: EIH Associated Hotels Ltd has a market capitalization of 1,835.71 Cr, categorizing it as a Small Cap company.<BR><BR>Recent Quarterly Performance: The sum of Net Sales for the latest 4 quarters is 380.97 Cr, while the sum of Net Profit for the same period is 87.88 Cr.<BR><BR>Balance Sheet Snapshot: The reporting period is the latest annual period. However, data for Shareholder's Funds and Total Assets is unavailable.

View full answer

Should I buy, sell or hold EIH Associated Hotels Ltd?

12-Aug-2026

Are EIH Associated Hotels Ltd latest results good or bad?

05-Aug-2026

EIH Associated Hotels Ltd's latest results are concerning, showing a 4.02% year-on-year revenue decline and an 11.47% drop in net profit. Sequentially, revenue fell by 48.12% and net profit by 81.69%, indicating significant operational challenges in a seasonal business model.

EIH Associated Hotels Ltd's latest results indicate a challenging quarter. The company reported a revenue decline of 4.02% year-on-year, totaling ₹65.98 crores, and a significant drop in net profit, which fell by 11.47% to ₹6.89 crores. More concerning is the sequential performance, where revenue decreased by 48.12% and net profit plummeted by 81.69% compared to the previous quarter. <BR><BR>Operating margins also contracted sharply to 10.82%, down from 13.06% in the same quarter last year. This decline reflects the seasonal pressures typical in the luxury hospitality sector, particularly during the summer months when leisure travel demand is subdued. The company's reliance on non-operating income to support profitability raises concerns about the sustainability of its earnings during off-peak periods.<BR><BR>Overall, the results suggest that EIH Associated Hotels is facing significant operational challenges, particularly related to its seasonal business model, which has led to declining profitability and heightened earnings volatility.

View full answer

When is the next results date for EIH Associated Hotels Ltd?

29-Jul-2026

The next results date for EIH Associated Hotels Ltd is August 4, 2026.

The next results date for EIH Associated Hotels Ltd is scheduled for August 4, 2026.

View full answer

How has been the historical performance of EIH Assoc.Hotels?

12-Nov-2025

EIH Assoc.Hotels showed fluctuating financial performance from 2008 to 2012, with net sales rising to 196.71 Cr in March 2012 and profit after tax increasing to 12.04 Cr, despite a slight decrease in operating profit margin. Overall, the company demonstrated revenue growth and improved profitability amid rising costs.

Answer:<BR>The historical performance of EIH Assoc.Hotels shows a fluctuating trend in key financial metrics over the years from 2008 to 2012.<BR><BR>Breakdown:<BR>EIH Assoc.Hotels experienced a rise in net sales from 181.04 Cr in March 2011 to 196.71 Cr in March 2012, following a peak of 185.15 Cr in March 2008. Other operating income also increased, reaching 1.66 Cr in March 2012, up from 1.36 Cr in the previous year. Total operating income followed a similar upward trajectory, totaling 198.37 Cr in March 2012 compared to 182.39 Cr in March 2011. However, total expenditure, excluding depreciation, rose to 141.94 Cr in March 2012 from 127.98 Cr in March 2011. Operating profit (PBDIT) increased to 57.65 Cr in March 2012, while profit before tax also improved to 18.04 Cr. The profit after tax saw a notable increase to 12.04 Cr in March 2012, compared to 9.32 Cr in March 2011. Earnings per share (EPS) rose to 5.38 in March 2012, reflecting a positive trend in profitability. The operating profit margin slightly decreased to 28.45% in March 2012 from 29.83% in March 2011, while the PAT margin improved to 6.07%. Cash flow from operating activities was 53.40 Cr in March 2012, down from 56.00 Cr in March 2011, but the net cash inflow increased to 1.50 Cr in March 2012. Overall, the financial performance of EIH Assoc.Hotels indicates a recovery and growth in revenue and profitability, despite rising costs.

View full answer

Is EIH Assoc.Hotels technically bullish or bearish?

11-Nov-2025

As of November 10, 2025, EIH Assoc. Hotels exhibits a neutral technical trend with mixed signals, showing a mildly bearish stance in weekly and monthly indicators, while daily moving averages suggest mild bullishness.

As of 10 November 2025, the technical trend for EIH Assoc. Hotels has changed from mildly bearish to sideways. The current technical stance is neutral, with mixed signals across different indicators. The weekly MACD remains bearish, while the monthly MACD is mildly bearish. The Bollinger Bands indicate a bearish trend on the monthly and mildly bearish on the weekly. Moving averages show a mildly bullish stance on the daily timeframe, contrasting with the overall bearish sentiment in the weekly and monthly indicators. The Dow Theory suggests a mildly bullish trend on the monthly but no trend on the weekly. Overall, the strength of the current neutral stance is weak, with no strong bullish or bearish signals prevailing.

View full answer

Is EIH Assoc.Hotels overvalued or undervalued?

16-Sep-2025

As of September 15, 2025, EIH Associates Hotels is fairly valued with a PE ratio of 24.79, lower than its peers, and has delivered a 73.77% return over the past three years, outperforming the Sensex.

As of 15 September 2025, the valuation grade for EIH Associates Hotels has moved from expensive to fair. The company appears to be fairly valued at this time. Key ratios include a PE ratio of 24.79, an EV to EBITDA of 16.64, and a PEG ratio of 0.90, which suggests a reasonable growth expectation relative to its price.<BR><BR>In comparison to its peers, EIH Associates Hotels stands out with a significantly lower PE ratio than Indian Hotels Co, which has a PE of 66.03, and ITC Hotels at 72.7. This positions EIH as a more attractive option within the Hotels & Resorts industry. Notably, the company's return over the last three years has been impressive at 73.77%, significantly outperforming the Sensex's 36.46% during the same period, reinforcing its fair valuation status.

View full answer

Who are the top shareholders of the EIH Assoc.Hotels?

17-Jul-2025

The top shareholders of EIH Assoc. Hotels include EIH Limited with 36.81%, Jupiter India Fund at 9.98%, and 33 Foreign Institutional Investors holding 13.7%. Individual investors own 9.16%, with no pledged promoter holdings or mutual fund investments.

The top shareholders of EIH Assoc. Hotels include EIH Limited, which holds the largest stake at 36.81%. Additionally, Jupiter India Fund is the highest public shareholder with a 9.98% ownership. The company also has 33 Foreign Institutional Investors (FIIs) collectively holding 13.7% of the shares. Individual investors own 9.16% of the company. There are no pledged promoter holdings, and no mutual funds are currently holding shares in the company.

View full answer

What is the bonus history of the EIH Assoc.Hotels?

06-Jun-2025

EIH Associated Hotels recently announced a 1:1 bonus issue, with an ex-date of August 13, 2024, meaning shareholders will receive one additional share for each share held as of that date.

EIH Associated Hotels has a recent bonus issue where they announced a 1:1 bonus. The ex-date for this bonus is set for August 13, 2024. This means that shareholders will receive one additional share for every share they hold as of that date. This is the latest information regarding their bonus history. If you have any more questions about the company or its financials, feel free to ask!

View full answer

Has EIH Assoc.Hotels declared dividend?

06-Jun-2025

EIH Associated Hotels Ltd has declared a 60% dividend, amounting to ₹6 per share, with an ex-date of August 13, 2024. The company has shown strong total returns over various periods, particularly with a 191.7% total return over the last 5 years.

EIH Associated Hotels Ltd has declared a 60% dividend.<BR><BR>Dividend Details:<BR>- Percentage announced: 60%<BR>- Amount per share: 6<BR>- Ex-date: 13 Aug 24<BR><BR>Dividend Yield: 1.58%.<BR><BR>Total Returns by Period:<BR>In the last 6 months, the price return was -6.78%, the dividend return was 0%, resulting in a total return of -6.78%.<BR><BR>Over the past year, the price return was 9.55%, the dividend return was 1.44%, leading to a total return of 10.99%.<BR><BR>In the 2-year period, the price return was 50.56%, the dividend return was 4.28%, which resulted in a total return of 54.84%.<BR><BR>For the 3-year period, the price return was 92.51%, the dividend return was 6.56%, culminating in a total return of 99.07%.<BR><BR>In the last 4 years, the price return was 103.59%, the dividend return was 6.24%, resulting in a total return of 109.83%.<BR><BR>Finally, over the 5-year period, the price return was 182.68%, the dividend return was 9.02%, leading to a total return of 191.7%.<BR><BR>Overall, EIH Associated Hotels has declared a significant dividend, and the total returns over various periods indicate a strong performance, particularly in the longer term, with substantial growth in both price and dividends.

View full answer
iScoreScore
Click here to find our call on this stock
Strong Sell
Sell
Hold
Buy
Strong Buy

Dashboard

1

Negative results in Jun 26

  • NET SALES(Q) At Rs 65.98 cr has Fallen at -31.2% (vs previous 4Q average)
  • PBT LESS OI(Q) At Rs 2.59 cr has Fallen at -89.8% (vs previous 4Q average)
  • PAT(Q) At Rs 6.89 cr has Fallen at -69.4% (vs previous 4Q average)
2

Despite the size of the company, domestic mutual funds hold only 0% of the company

3

Below par performance in long term as well as near term

stock-summaryMojo Parameters

Mojo Parameters

Loading Valuation Snapshot...

Stock DNA

stock-summary
Industry

Hotels & Resorts

stock-summary
Market cap

INR 1,834 Cr (Small Cap)

stock-summary
P/E

21.00

stock-summary
Industry P/E

36

stock-summary
Dividend Yield

1.16%

stock-summary
Debt Equity

-0.35

stock-summary
Return on Equity

14.89%

stock-summary
Price to Book

3.05

Revenue and Profits:
Net Sales:
66 Cr
(Quarterly Results - Jun 2026)
Net Profit:
7 Cr
stock-summaryTotal Returns
Total Returns (Price + Dividend) stock-summary
Dividend Yield (1.16%)
TimePeriod
Price Return
Dividend Return
Total Return
3 Months
-4.23%
1.17%
-3.06%
6 Months
-6.77%
1.12%
-5.65%
1 Year
-20.54%
0.86%
-19.68%
2 Years
-24.93%
1.64%
-23.29%
3 Years
23.0%
5.45%
28.45%
4 Years
39.6%
6.58%
46.18%
5 Years
97.54%
7.18%
104.72%

Latest dividend: 3.5118835893290217 per share ex-dividend date: Jul-28-2026

Risk Adjusted Returns v/s stock-summary
Returns Beta
Icon
Beta has not been calculated since enough price history is not available
stock-summaryNews & Corporate Actions

News

EIH Associated Hotels Ltd Declines 1.21%: Financial and Technical Weakness Drive the Week

Announcements stock-summary

EIH Associated Hotels Limited - Other General Purpose

03-Dec-2019 | Source : NSE

EIH Associated Hotels Limited has informed the Exchange that as per Regulation 23 sub-regulation 9 of the SEBI (Listing Obligations and Disclosure Requirements) Regulations, 2015, the Company has submitted a copy of Related Party Disclosures being filed with stock exchanges within 30 days from the date of publication of the Company s standalone financial results for the quarter and half-year ended September, 2019.

EIH Associated Hotels Limited - Updates

05-Nov-2019 | Source : NSE

EIH Associated Hotels Limited has informed the Exchange regarding 'Limited Review Report on Unaudited Financial Results for the quarter and half-year ended 30th September 2019 with UDIN'.

EIH Associated Hotels Limited - Updates

17-Oct-2019 | Source : NSE

EIH Associated Hotels Limited has informed the Exchange regarding 'Certificate under Regulation 74(5) of the SEBI (Depositories and Participants) Regulations, 2018 for the quarter ended 30th September 2019'.

Corporate Actions stock-summary

stock-summary
BOARD MEETING

No Upcoming Board Meetings

stock-summary
DIVIDEND

EIH Associated Hotels Ltd has declared 35% dividend, ex-date: 28 Jul 26

stock-summary
SPLITS

No Splits history available

stock-summary
BONUS

EIH Associated Hotels Ltd has announced 1:1 bonus issue, ex-date: 13 Aug 24

stock-summary
RIGHTS

EIH Associated Hotels Ltd has announced 5:9 rights issue, ex-date: 11 Sep 12

stock-summaryKey Factors

Quality key factors stock-summary

Factor
Value
Sales Growth (5y)
27.94%
EBIT Growth (5y)
39.39%
EBIT to Interest (avg)
84.43
Debt to EBITDA (avg)
0.10
Net Debt to Equity (avg)
-0.35
Sales to Capital Employed (avg)
0.73
Tax Ratio
25.03%
Dividend Payout Ratio
23.22%
Pledged Shares
0
Institutional Holding
13.65%
ROCE (avg)
25.20%
ROE (avg)
14.08%

Valuation key factors

Factor
Value
P/E Ratio
21
Industry P/E
36
Price to Book Value
3.05
EV to EBIT
16.32
EV to EBITDA
13.91
EV to Capital Employed
4.17
EV to Sales
4.27
PEG Ratio
NA
Dividend Yield
1.16%
ROCE (Latest)
26.07%
ROE (Latest)
14.89%

Technicals key factors

Indicator
Weekly
Monthly
MACD
Bearish
Bearish
RSI
No Signal
No Signal
Bollinger Bands
Mildly Bearish
Bearish
Moving Averages
Bearish (Daily)
KST
Bearish
Bearish
Dow Theory
Mildly Bearish
Mildly Bearish
OBV
Mildly Bullish
Mildly Bullish
stock-summary Technical Indicator Scale: Bearish, Mildly Bearish, Sideways, Mildly Bullish, Bullish  Turned 
stock-summaryShareholding
Shareholding Snapshot : Jun 2026stock-summary
Shareholding Compare (%holding) stock-summary
Majority shareholders

Promoters

Pledged Promoter Holdings

None

Mutual Funds

Held by 1 Schemes (0.0%)

FIIs

Held by 30 FIIs (13.64%)

Promoter with highest holding

Eih Limited (36.81%)

Highest Public shareholder

Jupiter India Fund (9.98%)

Individual Investors Holdings

9.19%

stock-summaryFinancial
[
  {
    "link": "quarterly",
    "btn_text": "All Quarterly Results",
    "header": "Quarterly Results Snapshot (Standalone) - Jun'26 - QoQ",
    "rhs": [
      {
        "prefix": "Net Sales ",
        "suffix": "QoQ Growth in quarter ended Jun 2026 is -48.12% vs -1.76% in Mar 2026",
        "dir": -1
      },
      {
        "prefix": "Standalone Net Profit ",
        "suffix": "QoQ Growth in quarter ended Jun 2026 is -81.69% vs -7.29% in Mar 2026",
        "dir": -1
      }
    ],
    "table": {
      "header": [
        "Jun'26",
        "Mar'26",
        "Change(%)"
      ],
      "body": [
        {
          "field": "Net Sales",
          "val1": "65.98",
          "val2": "127.19",
          "chgp": "-48.12%",
          "chgp_class": "negative"
        },
        {
          "field": "Operating Profit (PBDIT) excl Other Income",
          "val1": "7.14",
          "val2": "49.66",
          "chgp": "-85.62%",
          "chgp_class": "negative"
        },
        {
          "field": "Interest",
          "val1": "0.12",
          "val2": "0.11",
          "chgp": "9.09%",
          "chgp_class": "negative"
        },
        {
          "field": "Exceptional Items",
          "val1": "0.00",
          "val2": "0.00",
          "chgp": "",
          "chgp_class": "neutral"
        },
        {
          "field": "Standalone Net Profit",
          "val1": "6.89",
          "val2": "37.63",
          "chgp": "-81.69%",
          "chgp_class": "negative"
        },
        {
          "field": "Operating Profit Margin (Excl OI)",
          "val1": "10.82%",
          "val2": "39.04%",
          "chgp": "-28.22%",
          "chgp_class": "negative"
        }
      ]
    }
  },
  {
    "link": "half-yearly",
    "btn_text": "All Half Yearly Results",
    "header": "Half Yearly Results Snapshot (Standalone) - Sep'25",
    "rhs": [
      {
        "prefix": "Net Sales ",
        "suffix": " Growth in half year ended Sep 2025 is -6.10% vs 7.70% in Sep 2024",
        "dir": -1
      },
      {
        "prefix": "Standalone Net Profit ",
        "suffix": " Growth in half year ended Sep 2025 is 58.13% vs -10.58% in Sep 2024",
        "dir": 1
      }
    ],
    "table": {
      "header": [
        "Sep'25",
        "Sep'24",
        "Change(%)"
      ],
      "body": [
        {
          "field": "Net Sales",
          "val1": "127.07",
          "val2": "135.32",
          "chgp": "-6.10%",
          "chgp_class": "negative"
        },
        {
          "field": "Operating Profit (PBDIT) excl Other Income",
          "val1": "11.66",
          "val2": "12.01",
          "chgp": "-2.91%",
          "chgp_class": "negative"
        },
        {
          "field": "Interest",
          "val1": "0.23",
          "val2": "0.20",
          "chgp": "15.00%",
          "chgp_class": "negative"
        },
        {
          "field": "Exceptional Items",
          "val1": "-0.47",
          "val2": "-4.19",
          "chgp": "88.78%",
          "chgp_class": "positive"
        },
        {
          "field": "Standalone Net Profit",
          "val1": "8.95",
          "val2": "5.66",
          "chgp": "58.13%",
          "chgp_class": "positive"
        },
        {
          "field": "Operating Profit Margin (Excl OI)",
          "val1": "9.18%",
          "val2": "8.88%",
          "chgp": "0.30%",
          "chgp_class": "positive"
        }
      ]
    }
  },
  {
    "link": "nine-monthly",
    "btn_text": "All Nine Monthly Results",
    "header": "Nine Monthly Results Snapshot (Standalone) - Dec'25",
    "rhs": [
      {
        "prefix": "Net Sales ",
        "suffix": "YoY Growth in nine months ended Dec 2025 is -4.39% vs 6.36% in Dec 2024",
        "dir": -1
      },
      {
        "prefix": "Standalone Net Profit ",
        "suffix": "YoY Growth in nine months ended Dec 2025 is 8.71% vs 3.08% in Dec 2024",
        "dir": 1
      }
    ],
    "table": {
      "header": [
        "Dec'25",
        "Dec'24",
        "Change(%)"
      ],
      "body": [
        {
          "field": "Net Sales",
          "val1": "256.54",
          "val2": "268.33",
          "chgp": "-4.39%",
          "chgp_class": "negative"
        },
        {
          "field": "Operating Profit (PBDIT) excl Other Income",
          "val1": "69.21",
          "val2": "65.82",
          "chgp": "5.15%",
          "chgp_class": "positive"
        },
        {
          "field": "Interest",
          "val1": "0.36",
          "val2": "0.31",
          "chgp": "16.13%",
          "chgp_class": "negative"
        },
        {
          "field": "Exceptional Items",
          "val1": "-3.75",
          "val2": "-4.19",
          "chgp": "10.50%",
          "chgp_class": "positive"
        },
        {
          "field": "Standalone Net Profit",
          "val1": "49.54",
          "val2": "45.57",
          "chgp": "8.71%",
          "chgp_class": "positive"
        },
        {
          "field": "Operating Profit Margin (Excl OI)",
          "val1": "26.98%",
          "val2": "24.53%",
          "chgp": "2.45%",
          "chgp_class": "positive"
        }
      ]
    }
  },
  {
    "link": "annual",
    "btn_text": "All Annual Results",
    "header": "Annual Results Snapshot (Standalone) - Mar'26",
    "rhs": [
      {
        "prefix": "Net Sales ",
        "suffix": "YoY Growth in year ended Mar 2026 is -6.00% vs 6.09% in Mar 2025",
        "dir": -1
      },
      {
        "prefix": "Standalone Net Profit ",
        "suffix": "YoY Growth in year ended Mar 2026 is -5.10% vs 13.35% in Mar 2025",
        "dir": -1
      }
    ],
    "table": {
      "header": [
        "Mar'26",
        "Mar'25",
        "Change(%)"
      ],
      "body": [
        {
          "field": "Net Sales",
          "val1": "383.73",
          "val2": "408.24",
          "chgp": "-6.00%",
          "chgp_class": "negative"
        },
        {
          "field": "Operating Profit (PBDIT) excl Other Income",
          "val1": "118.87",
          "val2": "126.39",
          "chgp": "-5.95%",
          "chgp_class": "negative"
        },
        {
          "field": "Interest",
          "val1": "0.47",
          "val2": "0.42",
          "chgp": "11.90%",
          "chgp_class": "negative"
        },
        {
          "field": "Exceptional Items",
          "val1": "-3.75",
          "val2": "-4.19",
          "chgp": "10.50%",
          "chgp_class": "positive"
        },
        {
          "field": "Standalone Net Profit",
          "val1": "87.17",
          "val2": "91.85",
          "chgp": "-5.10%",
          "chgp_class": "negative"
        },
        {
          "field": "Operating Profit Margin (Excl OI)",
          "val1": "30.98%",
          "val2": "30.96%",
          "chgp": "0.02%",
          "chgp_class": "positive"
        }
      ]
    }
  }
]

Quarterly Results Snapshot (Standalone) - Jun'26 - QoQstock-summary

Jun'26
Mar'26
Change(%)
Net Sales
65.98
127.19
-48.12%
Operating Profit (PBDIT) excl Other Income
7.14
49.66
-85.62%
Interest
0.12
0.11
9.09%
Exceptional Items
0.00
0.00
Standalone Net Profit
6.89
37.63
-81.69%
Operating Profit Margin (Excl OI)
10.82%
39.04%
-28.22%
Values in Rs Cr.
Direction Arrows
Net Sales

QoQ Growth in quarter ended Jun 2026 is -48.12% vs -1.76% in Mar 2026

Direction Arrows
Standalone Net Profit

QoQ Growth in quarter ended Jun 2026 is -81.69% vs -7.29% in Mar 2026

Half Yearly Results Snapshot (Standalone) - Sep'25stock-summary

Sep'25
Sep'24
Change(%)
Net Sales
127.07
135.32
-6.10%
Operating Profit (PBDIT) excl Other Income
11.66
12.01
-2.91%
Interest
0.23
0.20
15.00%
Exceptional Items
-0.47
-4.19
88.78%
Standalone Net Profit
8.95
5.66
58.13%
Operating Profit Margin (Excl OI)
9.18%
8.88%
0.30%
Values in Rs Cr.
Direction Arrows
Net Sales

Growth in half year ended Sep 2025 is -6.10% vs 7.70% in Sep 2024

Direction Arrows
Standalone Net Profit

Growth in half year ended Sep 2025 is 58.13% vs -10.58% in Sep 2024

Nine Monthly Results Snapshot (Standalone) - Dec'25stock-summary

Dec'25
Dec'24
Change(%)
Net Sales
256.54
268.33
-4.39%
Operating Profit (PBDIT) excl Other Income
69.21
65.82
5.15%
Interest
0.36
0.31
16.13%
Exceptional Items
-3.75
-4.19
10.50%
Standalone Net Profit
49.54
45.57
8.71%
Operating Profit Margin (Excl OI)
26.98%
24.53%
2.45%
Values in Rs Cr.
Direction Arrows
Net Sales

YoY Growth in nine months ended Dec 2025 is -4.39% vs 6.36% in Dec 2024

Direction Arrows
Standalone Net Profit

YoY Growth in nine months ended Dec 2025 is 8.71% vs 3.08% in Dec 2024

Annual Results Snapshot (Standalone) - Mar'26stock-summary

Mar'26
Mar'25
Change(%)
Net Sales
383.73
408.24
-6.00%
Operating Profit (PBDIT) excl Other Income
118.87
126.39
-5.95%
Interest
0.47
0.42
11.90%
Exceptional Items
-3.75
-4.19
10.50%
Standalone Net Profit
87.17
91.85
-5.10%
Operating Profit Margin (Excl OI)
30.98%
30.96%
0.02%
Values in Rs Cr.
Direction Arrows
Net Sales

YoY Growth in year ended Mar 2026 is -6.00% vs 6.09% in Mar 2025

Direction Arrows
Standalone Net Profit

YoY Growth in year ended Mar 2026 is -5.10% vs 13.35% in Mar 2025

stock-summaryCompany CV
About EIH Associated Hotels Ltd stock-summary
stock-summary
EIH Associated Hotels Ltd
Small Cap
Hotels & Resorts
EIH Associated Hotels Limited is in the business of hotel operation. Their principal activity is to provide hotel and resort services. The company's hotels include The Oberoi Cecil, Shimla; The Oberoi Rajvilas, Jaipur; Trident, Agra; Trident, Bhubaneshwar; Trident, Chennai; Trident, Jaipur; Trident, Udaipur, and Trident, Cochin. Island Hotel Maharaj Ltd is the wholly owned subsidiary of the company.
Company Coordinates stock-summary
Company Details
1/24 G S T Road, Meenambakkam Chennai Tamil Nadu : 600027
stock-summary
Tel: 91-044-22374747
stock-summary
invcom@tridenthotels.com/isdho@ober
Registrar Details
EIH Ltd , 4, Mangoe Lane, Calcutta