
Compare Eiko Lifescience with Similar Stocks
Stock DNA
Specialty Chemicals
INR 72 Cr (Micro Cap)
16.00
21
0.00%
0.07
6.54%
1.07
Total Returns (Price + Dividend) 
Latest dividend: 0.2 per share ex-dividend date: Sep-20-2017
Risk Adjusted Returns v/s
Returns Beta

News
Eiko Lifesciences Ltd is Rated Sell
Eiko Lifesciences Ltd is rated Sell by MarketsMOJO, with this rating last updated on 15 June 2026. However, the analysis and financial metrics discussed here reflect the stock's current position as of 17 June 2026, providing investors with the most up-to-date view of the company’s fundamentals, returns, and technical outlook.
Read full news articleAre Eiko Lifesciences Ltd latest results good or bad?
Eiko Lifesciences Ltd's latest financial results for Q4 FY26 present a complex picture characterized by significant topline growth alongside notable margin pressures. The company reported net sales of ₹18.34 crores, reflecting a robust year-on-year growth of 62.73% and a sequential increase of 53.09%. This performance marks the highest quarterly revenue in the company's history, indicating strong demand in its speciality chemicals segment. However, the operational metrics reveal challenges in profitability. The net profit for the quarter stood at ₹1.30 crores, which is a 23.81% increase year-on-year and a 7.44% rise quarter-on-quarter. Despite this profit growth, the operating margin (excluding other income) contracted to 12.43%, down from 15.69% in the previous quarter, raising concerns about the sustainability of this growth. The decline in margins suggests potential issues with pricing power or increase...
Read full news article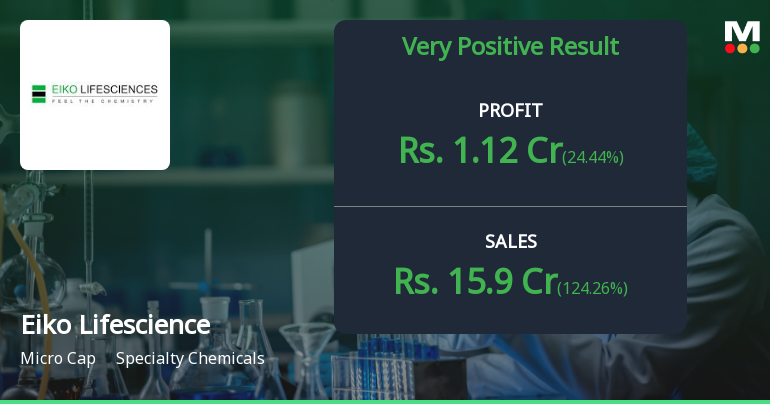
Eiko Lifesciences Q4 FY26: Strong Revenue Surge Masks Profitability Concerns
Eiko Lifesciences Ltd., a speciality chemicals manufacturer, reported a consolidated net profit of ₹1.30 crores for Q4 FY26, marking a modest sequential increase of 7.44% from ₹1.21 crores in Q3 FY26, though significantly ahead of the ₹1.05 crores posted in Q4 FY25—a year-on-year gain of 23.81%. The micro-cap company, with a market capitalisation of ₹73.00 crores, saw its stock surge 7.39% on May 26 to close at ₹53.03, as investors responded positively to the topline momentum despite lingering concerns about profitability metrics and weak return ratios.
Read full news article Announcements
Announcement under Regulation 30 (LODR)-Newspaper Publication
27-May-2026 | Source : BSENewspaper publication dated 27th May 2026 for Audited Financial Results (Standalone & Consolidated) of the Company for the Quarter and Year ended 31st March 2026 approved by the Board at their meeting held on 26th May 2026.
Board Meeting Outcome for Outcome Of The Board Meeting
26-May-2026 | Source : BSEAudited Financial Results (Standalone and Consolidated) for quarter and year ended 31st March 2026
Announcement under Regulation 30 (LODR)-Change in Management
26-May-2026 | Source : BSERe-appointment of M/s NP Rajput & Co as Internal Auditor for FY 2026-27 at the Board Meeting held on 26th May 2026.
Corporate Actions

No Upcoming Board Meetings

Eiko Lifesciences Ltd has declared 2% dividend, ex-date: 20 Sep 17

No Splits history available

No Bonus history available

Eiko Lifesciences Ltd has announced 2:3 rights issue, ex-date: 07 Jul 23
Quality key factors
Valuation key factors
Technicals key factors
 Technical Indicator Scale: Bearish, Mildly Bearish, Sideways, Mildly Bullish, Bullish Turned
 Shareholding Snapshot : Mar 2026
Shareholding Compare (%holding)
Non Institution
None
Held by 0 Schemes
Held by 0 FIIs
Lenus Finvest Private Limited (17.71%)
2b Black Bio Llp (9.62%)
41.69%
Quarterly Results Snapshot (Standalone) - Mar'26 - YoY

YoY Growth in quarter ended Mar 2026 is 124.26% vs -15.60% in Mar 2025

YoY Growth in quarter ended Mar 2026 is 24.44% vs 190.32% in Mar 2025
Half Yearly Results Snapshot (Consolidated) - Sep'25
Not Applicable: The company has declared_date for only one period
Not Applicable: The company has declared_date for only one period
Nine Monthly Results Snapshot (Consolidated) - Dec'25
YoY Growth in nine months ended Dec 2025 is 30.15% vs 117.28% in Dec 2024
YoY Growth in nine months ended Dec 2025 is 201.89% vs 178.95% in Dec 2024
Annual Results Snapshot (Consolidated) - Mar'26
Not Applicable: The company has declared_date for only one period
Not Applicable: The company has declared_date for only one period
About Eiko Lifesciences Ltd

Company Coordinates


