
Compare Elcid Investment with Similar Stocks
Dashboard
With a Operating Losses, the company has a Weak Long Term Fundamental Strength
- Poor long term growth as Net Sales has grown by an annual rate of 4.45% and Operating profit at 3.73%
Flat results in Mar 26
Despite the size of the company, domestic mutual funds hold only 0% of the company
Stock DNA
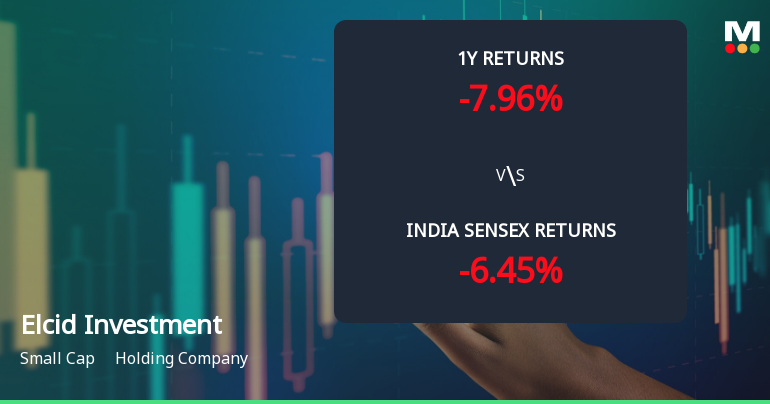
Holding Company
INR 2,336 Cr (Small Cap)
21.00
21
0.02%
0.00
1.25%
0.27
Total Returns (Price + Dividend) 
Latest dividend: 25 per share ex-dividend date: Jul-23-2025
Risk Adjusted Returns v/s
Returns Beta

News
Elcid Investments Ltd Technical Momentum Shifts Amid Bearish Sentiment
Elcid Investments Ltd, a small-cap holding company, has experienced a nuanced shift in its technical momentum, reflecting a complex interplay of bearish and mildly bullish signals. Despite a recent downgrade to a Strong Sell rating by MarketsMOJO, the stock’s technical indicators reveal a mixed outlook, underscoring the importance of a detailed analysis for investors navigating this evolving landscape.
Read full news article
Elcid Investments Ltd is Rated Strong Sell
Elcid Investments Ltd is rated Strong Sell by MarketsMOJO. This rating was last updated on 25 May 2026, reflecting a significant reassessment of the stock’s outlook. However, the analysis and financial metrics presented here are based on the company’s current position as of 21 June 2026, providing investors with the latest insights into its performance and prospects.
Read full news article
Elcid Investments Ltd Faces Bearish Momentum Amid Technical Downgrade
Elcid Investments Ltd, a small-cap holding company, has experienced a notable shift in its technical momentum, with recent indicators signalling a bearish trend despite some mixed signals across different timeframes. The stock’s current price stands at ₹1,18,400, reflecting a slight decline of 0.50% from the previous close of ₹1,18,991.95, as investors weigh the implications of these technical developments amid broader market conditions.
Read full news article Announcements
Closure of Trading Window
18-Jun-2026 | Source : BSEPlease find the enclosed letter for intimation of Closure of Trading Window for the quarter ending on June 30 2026.
Announcement under Regulation 30 (LODR)-Newspaper Publication
28-May-2026 | Source : BSEPlease find the attached revised Newspaper Publication of the Audited Standalone and Consolidated Financial Results for the fourth quarter and year ended March 31 2026.
Compliances-Reg.24(A)-Annual Secretarial Compliance
28-May-2026 | Source : BSEPlease find the enclosed letter with respect to Annual Secretarial Compliance Report for the year ended March 2026.
Corporate Actions

No Upcoming Board Meetings

Elcid Investments Ltd has declared 250% dividend, ex-date: 23 Jul 25

No Splits history available

No Bonus history available

No Rights history available
Quality key factors
Valuation key factors
Technicals key factors
 Technical Indicator Scale: Bearish, Mildly Bearish, Sideways, Mildly Bullish, Bullish Turned
 Shareholding Snapshot : Mar 2026
Shareholding Compare (%holding)
Promoters
None
Held by 0 Schemes
Held by 2 FIIs (0.01%)
Dipika Amar Vakil (47.53%)
Upnishad Holdings Private Limited (9.04%)
8.47%
Quarterly Results Snapshot (Consolidated) - Mar'26 - QoQ

QoQ Growth in quarter ended Mar 2026 is -203.21% vs 40.38% in Dec 2025
QoQ Growth in quarter ended Mar 2026 is -187.00% vs 49.28% in Dec 2025
Half Yearly Results Snapshot (Consolidated) - Sep'25
Growth in half year ended Sep 2025 is -41.87% vs 54.93% in Sep 2024
Growth in half year ended Sep 2025 is -42.95% vs 58.82% in Sep 2024
Nine Monthly Results Snapshot (Consolidated) - Dec'25
YoY Growth in nine months ended Dec 2025 is -13.53% vs 8.60% in Dec 2024
YoY Growth in nine months ended Dec 2025 is -13.21% vs 8.38% in Dec 2024
Annual Results Snapshot (Consolidated) - Mar'26
YoY Growth in year ended Mar 2026 is -36.55% vs -9.63% in Mar 2025
YoY Growth in year ended Mar 2026 is -29.07% vs -12.94% in Mar 2025
About Elcid Investments Ltd

Company Coordinates


