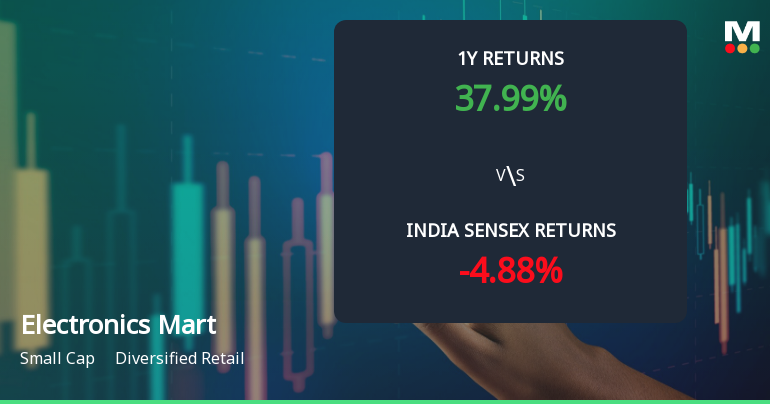
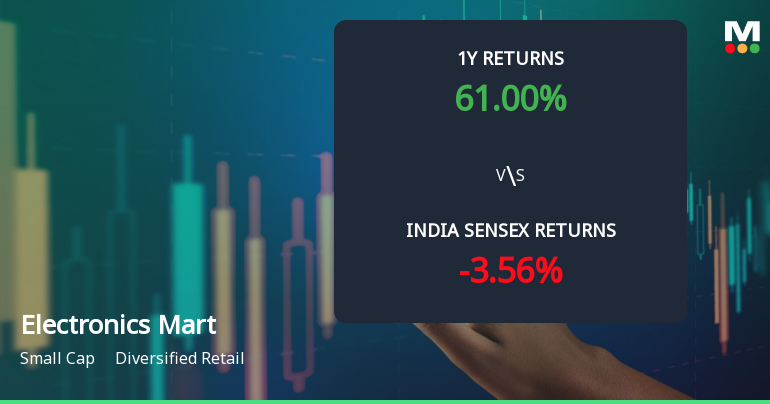
Electronics Mart

  • Market Cap: Small Cap
  • Industry: Diversified Retail
  • ISIN: INE02YR01019
  • NSEID: EMIL
  • BSEID: 543626
INR
116.07
-4.58 (-3.8%)
BSENSE

May 25

BSE+NSE Vol: 17.38 lacs

  • Price Points
  • Score
  • Mojo Parameters
  • Total Return
  • News and Corporate Actions
  • Key factors
  • Shareholding
  • Financials
  • CompanyCV
stock-summaryPrice Point
High/Low

1Day

52 Week

Valuation
Technical
Day's Volume

CASH

17.38 lacs (241.05%) Volume

Shareholding (Mar 2026)

FII

5.19%

Held by 31 FIIs

DII

20.08%

Held by 30 DIIs

Promoter

65.17%

Who are in the management team of Electronics Mart?

06-Jun-2025

As of March 2023, the management team of Electronics Mart includes Pavan Kumar Bajaj (Chairman & Managing Director), Karan Bajaj (Whole Time Director & CEO), Astha Bajaj (Whole Time Director & Executive Director), and three independent directors: Anil Nath, M. G. M. Baig, and Jyotsna Angara. They oversee the company's strategic direction and operations.

As of March 2023, the management team of Electronics Mart includes:<BR><BR>1. Pavan Kumar Bajaj - Chairman & Managing Director<BR>2. Karan Bajaj - Whole Time Director & CEO<BR>3. Astha Bajaj - Whole Time Director & Executive Director<BR>4. Anil Nath - Independent Additional Director<BR>5. M. G. M. Baig - Independent Additional Director<BR>6. Jyotsna Angara - Independent Director<BR><BR>This team is responsible for the strategic direction and operational management of the company.

View full answer

Has Electronics Mart declared dividend?

06-Jun-2025

No Dividend History Available

Who are the peers of the Electronics Mart?

16-Jul-2025

Electronics Mart's peers include Avenue Super., Vishal Mega Mart, V-Mart Retail, Shoppers Stop, and others. Management risk and growth vary among peers, with Avenue Super. and Vishal Mega Mart performing best, while Electronics Mart has average management risk and a 1-year return of -36.56%.

Peers: The peers of Electronics Mart are Avenue Super., Vishal Mega Mart, V-Mart Retail, Shoppers Stop, Spencer's Retail, Future Consumer, Aditya Consumer, Future Lifestyle, Future Enterp., and JHS Svend.Retail.<BR><BR>Quality Snapshot: Excellent management risk is observed at Avenue Super. and Vishal Mega Mart, while Average management risk is found at Shoppers Stop and Electronics Mart. Below Average management risk is present at V-Mart Retail, Spencer's Retail, Future Consumer, Aditya Consumer, Future Lifestyle, Future Enterp., and JHS Svend.Retail. Growth is Excellent at Avenue Super. and Vishal Mega Mart, Good at Shoppers Stop, Average at Electronics Mart, and Below Average at V-Mart Retail, Spencer's Retail, Future Consumer, Aditya Consumer, Future Lifestyle, Future Enterp., and JHS Svend.Retail. Capital Structure is Excellent at Avenue Super., Good at Aditya Consumer, Average at Shoppers Stop and Future Lifestyle, and Below Average at Electronics Mart, V-Mart Retail, Spencer's Retail, Future Consumer, Future Enterp., and JHS Svend.Retail.<BR><BR>Return Snapshot: The peer with the highest 1-year return is Vishal Mega Mart at N/A, while the peer with the lowest 1-year return is Future Consumer at -42.70%. Electronics Mart's 1-year return is -36.56%, which is higher than Future Consumer's but lower than Vishal Mega Mart's. Additionally, Spencer's Retail, Future Consumer, Aditya Consumer, and Future Enterp. all have negative six-month returns.

View full answer

What does Electronics Mart do?

17-Jul-2025

Electronics Mart India Ltd is a mid-cap retail company specializing in electronic goods and appliances, with net sales of ₹17,190 Cr and a net profit of ₹315 Cr as of March 2025. Established in 1980, it became a public limited company in 2018.

Overview: <BR>Electronics Mart India Ltd operates in the diversified retail industry, focusing on the sale of electronic goods and appliances, and is categorized as a mid-cap company.<BR><BR>History: <BR>Electronics Mart India Ltd was originally established in 1980 as a sole proprietorship named M/s. Bajaj Electronics in Hyderabad. It transitioned to a Partnership Firm in 2011 and later became a Public Limited Company on September 10, 2018. The latest quarterly results report net sales and profit for March 2025.<BR><BR>Financial Snapshot: <BR>Most recent Net Sales: 17,190 Cr (Quarterly Results - Mar 2025) <BR>Most recent Net Profit: 315 Cr (Quarterly Results - Mar 2025) <BR>Market-cap value: INR 5,435 Cr (Mid Cap)<BR><BR>Key Metrics: <BR>P/E: 34.00 <BR>Industry P/E: 85 <BR>Dividend Yield: 0.00% <BR>Debt-Equity: 1.27 <BR>Return on Equity: 10.45% <BR>Price to Book: 3.53 <BR><BR>Contact Details: <BR>No Company Details Available <BR>Registrar Address: Not available.

View full answer

Who are the top shareholders of the Electronics Mart?

17-Jul-2025

The top shareholders of Electronics Mart include Karan Bajaj, the largest promoter with 32.54%, mutual funds at 17.01%, foreign institutional investors at 7.18%, and SBI Small Cap Fund as the highest public shareholder with 6.91%. Individual investors collectively own 7.9% of the shares.

The top shareholders of Electronics Mart include the promoters, who hold the majority of the shares. Karan Bajaj is the promoter with the highest holding at 32.54%. Additionally, mutual funds hold 17.01% of the shares through 12 different schemes, while foreign institutional investors (FIIs) account for 7.18% through 30 different FIIs. The highest public shareholder is SBI Small Cap Fund, which holds 6.91%. Individual investors collectively hold 7.9% of the shares.

View full answer

How big is Electronics Mart?

24-Jul-2025

As of 24th July, Electronics Mart India Ltd has a market capitalization of 5,260.00 Cr, with recent Net Sales of 6,964.84 Cr and a Net Profit of 160.04 Cr.

As of 24th July, Electronics Mart India Ltd has a market capitalization of 5,260.00 Cr, categorizing it as a Mid Cap company.<BR><BR>For the latest four quarters, the company reported Net Sales of 6,964.84 Cr and a Net Profit of 160.04 Cr.<BR><BR>As of the latest annual period, the Shareholder's Funds were 1,369.66 Cr, and the Total Assets amounted to 3,027.37 Cr.

View full answer

Is Electronics Mart overvalued or undervalued?

07-Aug-2025

As of August 6, 2025, Electronics Mart is considered overvalued with a valuation grade of fair, reflected by a PE ratio of 40.90 and significant underperformance of -28.36% year-to-date compared to the Sensex's 3.08%.

As of 6 August 2025, the valuation grade for Electronics Mart has moved from attractive to fair, indicating a shift in market perception. The company is currently assessed as overvalued. Key ratios include a PE ratio of 40.90, an EV to EBIT of 24.21, and an EV to EBITDA of 16.15, which are significantly higher compared to peers like Crompton Greaves Consumer with a PE of 36.95 and an EV to EBITDA of 22.46, and Orient Electric, which has a PE of 50.98 and an EV to EBITDA of 21.08.<BR><BR>The stock has underperformed relative to the Sensex, with a year-to-date return of -28.36% compared to the Sensex's 3.08%. This underperformance, combined with the high valuation ratios, reinforces the conclusion that Electronics Mart is currently overvalued in the market.

View full answer

How has been the historical performance of Electronics Mart?

24-Nov-2025

Electronics Mart has demonstrated consistent growth in net sales and profits over the past five years, with net sales increasing from INR 3,201.88 crore in March 2021 to INR 6,731.31 crore in March 2025, despite some fluctuations in profit margins and cash flow. Total assets also rose significantly, indicating strong overall performance.

Answer:<BR>The historical performance of Electronics Mart shows a consistent growth trend in net sales and profits over the past five years.<BR><BR>Breakdown:<BR>Electronics Mart's net sales have steadily increased from INR 3,201.88 crore in March 2021 to INR 6,731.31 crore in March 2025, reflecting a robust growth trajectory. Total operating income followed a similar pattern, rising from INR 3,201.88 crore in March 2021 to INR 6,731.31 crore in March 2025. The company's operating profit (PBDIT) also demonstrated significant growth, climbing from INR 209.38 crore in March 2021 to INR 460.26 crore in March 2025. However, profit before tax peaked at INR 246.16 crore in March 2024 before declining to INR 216.04 crore in March 2025, while profit after tax showed a decrease from INR 183.95 crore in March 2024 to INR 160.49 crore in March 2025. The company's total assets increased from INR 1,340.85 crore in March 2020 to INR 3,656.83 crore in March 2025, indicating strong asset growth. Total liabilities also rose from INR 1,340.85 crore in March 2020 to INR 3,656.83 crore in March 2025. Cash flow from operating activities improved from INR 36 crore in March 2020 to INR 175 crore in March 2025, although the net cash outflow was recorded at INR 54 crore in March 2025. Overall, Electronics Mart has shown a solid performance with increasing revenues and assets, despite some fluctuations in profit margins and cash flow.

View full answer

Is Electronics Mart technically bullish or bearish?

25-Nov-2025

As of November 24, 2025, Electronics Mart's technical trend is mildly bearish, driven by bearish MACD and Bollinger Bands on longer timeframes, despite a mildly bullish daily moving average.

As of 24 November 2025, the technical trend has changed from sideways to mildly bearish. The current technical stance for Electronics Mart is mildly bearish. Key indicators driving this stance include a bearish MACD on the weekly timeframe, bearish Bollinger Bands across both weekly and monthly timeframes, and a mildly bearish signal from Dow Theory on the weekly chart. The daily moving averages show a mildly bullish signal, but this is overshadowed by the overall bearish sentiment in the longer timeframes. The stock has also underperformed significantly compared to the Sensex over the past month and year, further indicating weakness.

View full answer

When is the next results date for Electronics Mart India Ltd?

15-May-2026

The next results date for Electronics Mart India Ltd is 22 May 2026.

The next results date for Electronics Mart India Ltd is scheduled for 22 May 2026.

View full answer

Are Electronics Mart India Ltd latest results good or bad?

23-May-2026

Electronics Mart India Ltd's latest results show strong revenue growth with a 49.02% increase in net profit, but concerns remain due to a low PAT margin of 2.08% and high interest costs, making the overall performance mixed. While growth indicators are positive, profitability issues suggest caution.

Electronics Mart India Ltd's latest results for the quarter ended March 2026 present a mixed picture. On the positive side, the company reported a net profit of ₹39.73 crore, which is a significant increase of 49.02% year-on-year. Additionally, net sales grew by 14.96% compared to the same quarter last year, indicating strong revenue growth.<BR><BR>However, there are notable concerns as well. The company's profit after tax (PAT) margin remains low at 2.08%, which is below its historical averages, suggesting challenges in profitability despite revenue growth. The operating margin did improve to 6.73%, marking a quarterly high, but the overall financial performance is still constrained by high interest costs and depreciation charges.<BR><BR>The stock has shown some positive movement recently, gaining 4.07% in the latest trading session, but it remains significantly below its 52-week high, and the overall performance over the past year has been disappointing, with a decline of 3.76%.<BR><BR>In summary, while there are positive indicators in terms of profit growth and revenue expansion, the underlying issues related to profitability and high leverage raise concerns about the sustainability of this performance. Therefore, the results can be seen as good in terms of growth but bad when considering profitability and financial health.

View full answer

Should I buy, sell or hold Electronics Mart India Ltd?

23-May-2026

Why is Electronics Mart India Ltd falling/rising?

25-May-2026

As of 24-May, Electronics Mart India Ltd's stock price is rising to 120.30, up 4.07%. This increase is driven by strong investor participation, consistent gains over the past three days, and trading above key moving averages, despite some concerns regarding debt and declining profits.

As of 24-May, Electronics Mart India Ltd's stock price is rising, currently at 120.30, reflecting a change of 4.7 (4.07%) upward. This increase can be attributed to several factors. The stock has outperformed its sector by 0.55% today and has shown a consecutive gain over the last three days, with a total return of 4.43% during this period. Additionally, the stock reached an intraday high of Rs 127.2, marking a 10.03% increase at its peak.<BR><BR>The stock is also trading above its 5-day, 20-day, 50-day, 100-day, and 200-day moving averages, indicating a strong upward trend. Furthermore, there has been a significant increase in investor participation, with delivery volume rising by 273.96% compared to the 5-day average. The broader sector, Consumer Durables - Electronics, has also gained by 3.52%, contributing to the positive sentiment surrounding the stock.<BR><BR>Despite some negative factors, such as a high Debt to EBITDA ratio and declining profits over the past year, the stock is trading at a discount compared to its peers' average historical valuations. This valuation, along with high institutional holdings at 25.27%, suggests that informed investors are confident in the company's potential, further supporting the stock's rise. Overall, these elements combine to create a favorable environment for Electronics Mart India Ltd's stock price increase.

View full answer
iScoreScore
Click here to find our call on this stock
Strong Sell
Sell
Hold
Buy
Strong Buy

Dashboard

1

Low ability to service debt as the company has a high Debt to EBITDA ratio of 4.90 times

  • Low ability to service debt as the company has a high Debt to EBITDA ratio of 4.90 times
2

Poor long term growth as Net Sales has grown by an annual rate of 9.04% and Operating profit at 1.86% over the last 5 years

 
stock-summaryMojo Parameters

Mojo Parameters

Loading Valuation Snapshot...

Stock DNA

stock-summary
Industry

Diversified Retail

stock-summary
Market cap

INR 4,466 Cr (Small Cap)

stock-summary
P/E

49.00

stock-summary
Industry P/E

53

stock-summary
Dividend Yield

0.00%

stock-summary
Debt Equity

1.25

stock-summary
Return on Equity

5.96%

stock-summary
Price to Book

2.92

Revenue and Profits:
Net Sales:
1,913 Cr
(Quarterly Results - Mar 2026)
Net Profit:
40 Cr
stock-summaryTotal Returns
Total Returns (Price + Dividend) stock-summary
Dividend Yield (0%)
TimePeriod
Price Return
Dividend Return
Total Return
3 Months
16.01%
0%
16.01%
6 Months
-3.72%
0%
-3.72%
1 Year
-4.6%
0%
-4.6%
2 Years
-46.95%
0%
-46.95%
3 Years
56.11%
0%
56.11%
4 Years
0%
0%
0.0%
5 Years
0%
0%
0.0%

Electronics Mart for the last several years.

Risk Adjusted Returns v/s stock-summary
Returns Beta
Icon
Beta has not been calculated since enough price history is not available
stock-summaryNews & Corporate Actions

News

stock-summaryKey Factors

Quality key factors stock-summary

Factor
Value
Sales Growth (5y)
9.04%
EBIT Growth (5y)
1.86%
EBIT to Interest (avg)
2.65
Debt to EBITDA (avg)
4.03
Net Debt to Equity (avg)
1.25
Sales to Capital Employed (avg)
2.14
Tax Ratio
26.25%
Dividend Payout Ratio
0
Pledged Shares
0
Institutional Holding
25.27%
ROCE (avg)
10.86%
ROE (avg)
10.27%

Valuation key factors

Factor
Value
P/E Ratio
49
Industry P/E
53
Price to Book Value
2.92
EV to EBIT
24.26
EV to EBITDA
15.50
EV to Capital Employed
1.85
EV to Sales
0.93
PEG Ratio
NA
Dividend Yield
NA
ROCE (Latest)
7.45%
ROE (Latest)
5.96%

Technicals key factors

Indicator
Weekly
Monthly
MACD
Mildly Bullish
Mildly Bearish
RSI
Bearish
No Signal
Bollinger Bands
Bullish
Bearish
Moving Averages
Mildly Bearish (Daily)
KST
Bullish
Bearish
Dow Theory
Mildly Bearish
No Trend
OBV
Mildly Bullish
No Trend
stock-summary Technical Indicator Scale: Bearish, Mildly Bearish, Sideways, Mildly Bullish, Bullish  Turned 
stock-summaryShareholding
Shareholding Snapshot : Mar 2026stock-summary
Shareholding Compare (%holding) stock-summary
Majority shareholders

Promoters

Pledged Promoter Holdings

None

Mutual Funds

Held by 12 Schemes (19.48%)

FIIs

Held by 31 FIIs (5.19%)

Promoter with highest holding

Karan Bajaj (32.54%)

Highest Public shareholder

Sbi Small Cap Fund (6.91%)

Individual Investors Holdings

7.84%

stock-summaryFinancial
[
  {
    "link": "quarterly",
    "btn_text": "All Quarterly Results",
    "header": "Quarterly Results Snapshot (Consolidated) - Mar'26 - QoQ",
    "rhs": [
      {
        "prefix": "Net Sales ",
        "suffix": "QoQ Growth in quarter ended Mar 2026 is -1.36% vs 21.92% in Dec 2025",
        "dir": -1
      },
      {
        "prefix": "Consolidated Net Profit ",
        "suffix": "QoQ Growth in quarter ended Mar 2026 is 34.00% vs 83.71% in Dec 2025",
        "dir": -1
      }
    ],
    "table": {
      "header": [
        "Mar'26",
        "Dec'25",
        "Change(%)"
      ],
      "body": [
        {
          "field": "Net Sales",
          "val1": "1,913.25",
          "val2": "1,939.65",
          "chgp": "-1.36%",
          "chgp_class": "negative"
        },
        {
          "field": "Operating Profit (PBDIT) excl Other Income",
          "val1": "128.72",
          "val2": "118.47",
          "chgp": "8.65%",
          "chgp_class": "positive"
        },
        {
          "field": "Interest",
          "val1": "40.10",
          "val2": "38.32",
          "chgp": "4.65%",
          "chgp_class": "negative"
        },
        {
          "field": "Exceptional Items",
          "val1": "4.09",
          "val2": "-4.26",
          "chgp": "196.01%",
          "chgp_class": "positive"
        },
        {
          "field": "Consolidate Net Profit",
          "val1": "39.73",
          "val2": "29.65",
          "chgp": "34.00%",
          "chgp_class": "positive"
        },
        {
          "field": "Operating Profit Margin (Excl OI)",
          "val1": "6.73%",
          "val2": "6.11%",
          "chgp": "0.62%",
          "chgp_class": "positive"
        }
      ]
    }
  },
  {
    "link": "half-yearly",
    "btn_text": "All Half Yearly Results",
    "header": "Half Yearly Results Snapshot (Consolidated) - Sep'25",
    "rhs": [
      {
        "prefix": "Net Sales ",
        "suffix": " Growth in half year ended Sep 2025 is 2.09% vs 8.65% in Sep 2024",
        "dir": -1
      },
      {
        "prefix": "Consolidated Net Profit ",
        "suffix": " Growth in half year ended Sep 2025 is -62.36% vs 2.76% in Sep 2024",
        "dir": -1
      }
    ],
    "table": {
      "header": [
        "Sep'25",
        "Sep'24",
        "Change(%)"
      ],
      "body": [
        {
          "field": "Net Sales",
          "val1": "3,330.36",
          "val2": "3,262.10",
          "chgp": "2.09%",
          "chgp_class": "positive"
        },
        {
          "field": "Operating Profit (PBDIT) excl Other Income",
          "val1": "191.69",
          "val2": "242.10",
          "chgp": "-20.82%",
          "chgp_class": "negative"
        },
        {
          "field": "Interest",
          "val1": "75.92",
          "val2": "51.03",
          "chgp": "48.78%",
          "chgp_class": "negative"
        },
        {
          "field": "Exceptional Items",
          "val1": "7.02",
          "val2": "0.00",
          "chgp": "",
          "chgp_class": "neutral"
        },
        {
          "field": "Consolidate Net Profit",
          "val1": "37.76",
          "val2": "100.32",
          "chgp": "-62.36%",
          "chgp_class": "negative"
        },
        {
          "field": "Operating Profit Margin (Excl OI)",
          "val1": "5.76%",
          "val2": "7.42%",
          "chgp": "-1.66%",
          "chgp_class": "negative"
        }
      ]
    }
  },
  {
    "link": "nine-monthly",
    "btn_text": "All Nine Monthly Results",
    "header": "Nine Monthly Results Snapshot (Consolidated) - Dec'25",
    "rhs": [
      {
        "prefix": "Net Sales ",
        "suffix": "YoY Growth in nine months ended Dec 2025 is 4.00% vs 6.08% in Dec 2024",
        "dir": -1
      },
      {
        "prefix": "Consolidated Net Profit ",
        "suffix": "YoY Growth in nine months ended Dec 2025 is -49.63% vs -6.68% in Dec 2024",
        "dir": -1
      }
    ],
    "table": {
      "header": [
        "Dec'25",
        "Dec'24",
        "Change(%)"
      ],
      "body": [
        {
          "field": "Net Sales",
          "val1": "5,270.01",
          "val2": "5,067.08",
          "chgp": "4.00%",
          "chgp_class": "positive"
        },
        {
          "field": "Operating Profit (PBDIT) excl Other Income",
          "val1": "310.16",
          "val2": "343.66",
          "chgp": "-9.75%",
          "chgp_class": "negative"
        },
        {
          "field": "Interest",
          "val1": "114.24",
          "val2": "81.02",
          "chgp": "41.00%",
          "chgp_class": "negative"
        },
        {
          "field": "Exceptional Items",
          "val1": "2.76",
          "val2": "0.00",
          "chgp": "",
          "chgp_class": "neutral"
        },
        {
          "field": "Consolidate Net Profit",
          "val1": "67.41",
          "val2": "133.82",
          "chgp": "-49.63%",
          "chgp_class": "negative"
        },
        {
          "field": "Operating Profit Margin (Excl OI)",
          "val1": "5.89%",
          "val2": "6.78%",
          "chgp": "-0.89%",
          "chgp_class": "negative"
        }
      ]
    }
  },
  {
    "link": "annual",
    "btn_text": "All Annual Results",
    "header": "Annual Results Snapshot (Consolidated) - Mar'26",
    "rhs": [
      {
        "prefix": "Net Sales ",
        "suffix": "YoY Growth in year ended Mar 2026 is 6.71% vs 7.09% in Mar 2025",
        "dir": -1
      },
      {
        "prefix": "Consolidated Net Profit ",
        "suffix": "YoY Growth in year ended Mar 2026 is -33.24% vs -12.75% in Mar 2025",
        "dir": -1
      }
    ],
    "table": {
      "header": [
        "Mar'26",
        "Mar'25",
        "Change(%)"
      ],
      "body": [
        {
          "field": "Net Sales",
          "val1": "7,183.26",
          "val2": "6,731.31",
          "chgp": "6.71%",
          "chgp_class": "positive"
        },
        {
          "field": "Operating Profit (PBDIT) excl Other Income",
          "val1": "438.20",
          "val2": "451.12",
          "chgp": "-2.86%",
          "chgp_class": "negative"
        },
        {
          "field": "Interest",
          "val1": "153.67",
          "val2": "117.52",
          "chgp": "30.76%",
          "chgp_class": "negative"
        },
        {
          "field": "Exceptional Items",
          "val1": "6.84",
          "val2": "0.00",
          "chgp": "",
          "chgp_class": "neutral"
        },
        {
          "field": "Consolidate Net Profit",
          "val1": "107.14",
          "val2": "160.49",
          "chgp": "-33.24%",
          "chgp_class": "negative"
        },
        {
          "field": "Operating Profit Margin (Excl OI)",
          "val1": "6.10%",
          "val2": "6.70%",
          "chgp": "-0.60%",
          "chgp_class": "negative"
        }
      ]
    }
  }
]

Quarterly Results Snapshot (Consolidated) - Mar'26 - QoQstock-summary

Mar'26
Dec'25
Change(%)
Net Sales
1,913.25
1,939.65
-1.36%
Operating Profit (PBDIT) excl Other Income
128.72
118.47
8.65%
Interest
40.10
38.32
4.65%
Exceptional Items
4.09
-4.26
196.01%
Consolidate Net Profit
39.73
29.65
34.00%
Operating Profit Margin (Excl OI)
6.73%
6.11%
0.62%
Values in Rs Cr.
Direction Arrows
Net Sales

QoQ Growth in quarter ended Mar 2026 is -1.36% vs 21.92% in Dec 2025

Direction Arrows
Consolidated Net Profit

QoQ Growth in quarter ended Mar 2026 is 34.00% vs 83.71% in Dec 2025

Half Yearly Results Snapshot (Consolidated) - Sep'25stock-summary

Sep'25
Sep'24
Change(%)
Net Sales
3,330.36
3,262.10
2.09%
Operating Profit (PBDIT) excl Other Income
191.69
242.10
-20.82%
Interest
75.92
51.03
48.78%
Exceptional Items
7.02
0.00
Consolidate Net Profit
37.76
100.32
-62.36%
Operating Profit Margin (Excl OI)
5.76%
7.42%
-1.66%
Values in Rs Cr.
Direction Arrows
Net Sales

Growth in half year ended Sep 2025 is 2.09% vs 8.65% in Sep 2024

Direction Arrows
Consolidated Net Profit

Growth in half year ended Sep 2025 is -62.36% vs 2.76% in Sep 2024

Nine Monthly Results Snapshot (Consolidated) - Dec'25stock-summary

Dec'25
Dec'24
Change(%)
Net Sales
5,270.01
5,067.08
4.00%
Operating Profit (PBDIT) excl Other Income
310.16
343.66
-9.75%
Interest
114.24
81.02
41.00%
Exceptional Items
2.76
0.00
Consolidate Net Profit
67.41
133.82
-49.63%
Operating Profit Margin (Excl OI)
5.89%
6.78%
-0.89%
Values in Rs Cr.
Direction Arrows
Net Sales

YoY Growth in nine months ended Dec 2025 is 4.00% vs 6.08% in Dec 2024

Direction Arrows
Consolidated Net Profit

YoY Growth in nine months ended Dec 2025 is -49.63% vs -6.68% in Dec 2024

Annual Results Snapshot (Consolidated) - Mar'26stock-summary

Mar'26
Mar'25
Change(%)
Net Sales
7,183.26
6,731.31
6.71%
Operating Profit (PBDIT) excl Other Income
438.20
451.12
-2.86%
Interest
153.67
117.52
30.76%
Exceptional Items
6.84
0.00
Consolidate Net Profit
107.14
160.49
-33.24%
Operating Profit Margin (Excl OI)
6.10%
6.70%
-0.60%
Values in Rs Cr.
Direction Arrows
Net Sales

YoY Growth in year ended Mar 2026 is 6.71% vs 7.09% in Mar 2025

Direction Arrows
Consolidated Net Profit

YoY Growth in year ended Mar 2026 is -33.24% vs -12.75% in Mar 2025

stock-summaryCompany CV
About Electronics Mart India Ltd stock-summary
stock-summary
Electronics Mart India Ltd
Small Cap
Diversified Retail
Electronics Mart India Limited was originally formed as a sole proprietorship under the name of `M/s. Bajaj Electronics' at Hyderabad in 1980. The erstwhile sole proprietorship later converted into a Partnership Firm under the name of `M/s Bajaj Electronics' pursuant to Partnership Deed dated March 25, 2011 and subsequently, converted the Firm into a Public Limited Company with the name `Electronics Mart India Limited' effective from September 10, 2018.
Company Coordinates stock-summary
Icon
No Company Details Available