
Compare Elegant Marbles with Similar Stocks
Stock DNA
Diversified consumer products
INR 55 Cr (Micro Cap)
16.00
15
0.52%
-0.05
2.46%
0.39
Total Returns (Price + Dividend) 
Latest dividend: 1 per share ex-dividend date: Jul-09-2025
Risk Adjusted Returns v/s
Returns Beta

News

Elegant Marbles and Grani Industries Ltd is Rated Strong Sell
Elegant Marbles and Grani Industries Ltd is rated Strong Sell by MarketsMOJO. This rating was last updated on 21 May 2026, reflecting a shift from the previous 'Sell' grade. However, all fundamentals, returns, and financial metrics discussed here are current as of 29 May 2026, providing investors with the latest assessment of the stock's position.
Read full news article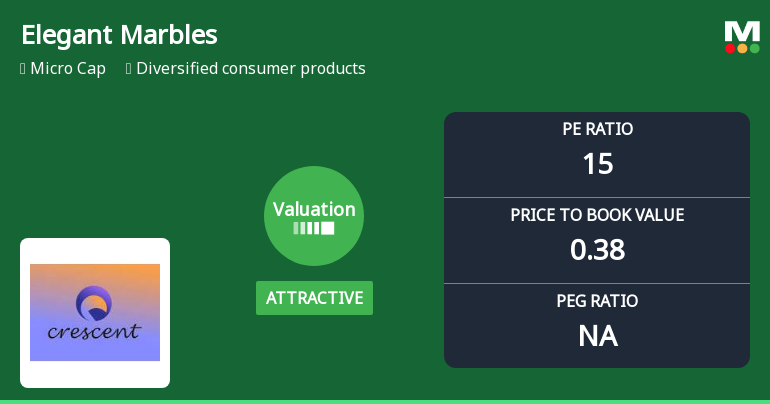
Elegant Marbles and Grani Industries Ltd: Valuation Shifts Signal Price Attractiveness Amid Market Volatility
Elegant Marbles and Grani Industries Ltd has recently undergone a notable shift in its valuation parameters, moving from a fair to an attractive valuation grade. This change, driven primarily by adjustments in its price-to-earnings (P/E) and price-to-book value (P/BV) ratios, offers investors a fresh perspective on the stock’s price attractiveness amid a challenging market backdrop.
Read full news articleAre Elegant Marbles and Grani Industries Ltd latest results good or bad?
Elegant Marbles and Grani Industries Ltd's latest financial results for Q4 FY26 reveal a complex picture of operational performance. The company reported net sales of ₹8.61 crores, reflecting a year-on-year growth of 33.70% compared to the same quarter last year. However, this represents a quarter-on-quarter decline of 19.83%, indicating volatility in revenue generation. The net profit for the quarter was ₹0.19 crores, which is a significant drop of 82.88% from the previous quarter, marking the lowest quarterly net profit in the last eight quarters, excluding a loss-making quarter in Q1 FY25. This decline in profitability is primarily attributed to an extraordinarily high tax rate of 68.85%, which heavily impacted the bottom line. The operating profit margin, excluding other income, decreased to 9.87% from 12.01% in the previous quarter, suggesting pressures on operational efficiency. Additionally, the pr...
Read full news article Announcements
Compliances-Reg.24(A)-Annual Secretarial Compliance
29-May-2026 | Source : BSEAnnual secretarial compliance report for the financial year 2025-2026.
Announcement under Regulation 30 (LODR)-Newspaper Publication
22-May-2026 | Source : BSESubmission of Newspaper clipping of QR code of audited financial results for the quarter and financial year end as on march 2026 as per Regulation 30 and 47 of the SEBI ( Listing Obligations and Disclosure Requirements) 2015.
Audited Financial Results For Quarter And Finanical Year Ended 31St March 2026
21-May-2026 | Source : BSEAudited Financial Results for quarter and financial year ended 31st March 2026
Corporate Actions

No Upcoming Board Meetings

Elegant Marbles and Grani Industries Ltd has declared 10% dividend, ex-date: 09 Jul 25

No Splits history available

No Bonus history available

No Rights history available
Quality key factors
Valuation key factors
Technicals key factors
 Technical Indicator Scale: Bearish, Mildly Bearish, Sideways, Mildly Bullish, Bullish Turned
 Shareholding Snapshot : Mar 2026
Shareholding Compare (%holding)
Promoters
None
Held by 0 Schemes
Held by 0 FIIs
Rakesh Ramswaroop Agrawal (23.69%)
Sapna Niraj Ved (3.71%)
26.05%
Quarterly Results Snapshot (Standalone) - Mar'26 - QoQ

QoQ Growth in quarter ended Mar 2026 is -19.83% vs 31.46% in Dec 2025
QoQ Growth in quarter ended Mar 2026 is -82.88% vs -8.26% in Dec 2025
Half Yearly Results Snapshot (Standalone) - Sep'25
Growth in half year ended Sep 2025 is -11.93% vs 4.10% in Sep 2024
Growth in half year ended Sep 2025 is -45.04% vs 43.46% in Sep 2024
Nine Monthly Results Snapshot (Standalone) - Dec'25

YoY Growth in nine months ended Dec 2025 is 16.43% vs -15.20% in Dec 2024
YoY Growth in nine months ended Dec 2025 is -26.51% vs 11.98% in Dec 2024
Annual Results Snapshot (Standalone) - Mar'26
YoY Growth in year ended Mar 2026 is 20.36% vs -16.63% in Mar 2025
YoY Growth in year ended Mar 2026 is -28.72% vs 16.05% in Mar 2025
About Elegant Marbles and Grani Industries Ltd

Company Coordinates


