
Compare Elgi Rubber Co with Similar Stocks
Dashboard
With a Operating Losses, the company has a Weak Long Term Fundamental Strength
- Low ability to service debt as the company has a high Debt to EBITDA ratio of -5.07 times
- The company has been able to generate a Return on Equity (avg) of 0.25% signifying low profitability per unit of shareholders funds
The company has declared Negative results for the last 5 consecutive quarters
Risky - Negative EBITDA
Below par performance in long term as well as near term
Stock DNA
Industrial Products
INR 312 Cr (Micro Cap)
NA (Loss Making)
84
0.00%
3.77
-112.56%
3.81
Total Returns (Price + Dividend) 
Latest dividend: 0.16 per share ex-dividend date: Mar-18-2020
Risk Adjusted Returns v/s
Returns Beta

News
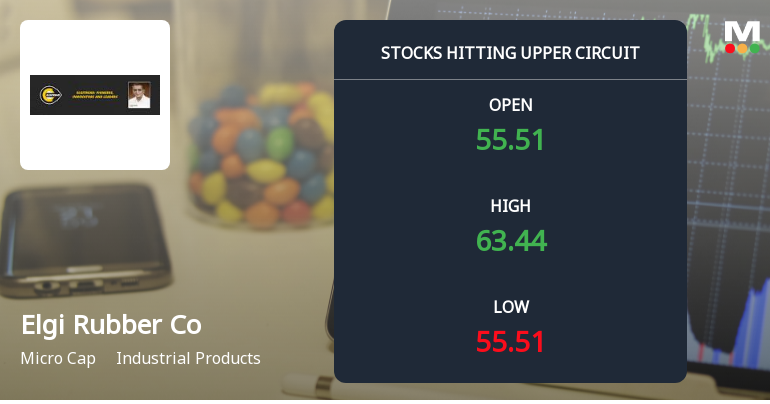
Elgi Rubber Company Ltd Locks at Upper Circuit With 9.64% Gain — Buyers Queue, Sellers Absent
At Rs 63.44, the buying was done — not because demand dried up, but because the exchange wouldn't let the stock go any higher. Elgi Rubber Company Ltd locked at its upper circuit of 9.64% on 16 Jul 2026, with buyers queuing and no sellers willing to part with shares.
Read full news article
Elgi Rubber Company Ltd is Rated Strong Sell
Elgi Rubber Company Ltd is rated Strong Sell by MarketsMOJO. This rating was last updated on 29 May 2025. However, the analysis and financial metrics presented here reflect the company’s current position as of 15 July 2026, providing investors with the latest insights into its performance and outlook.
Read full news article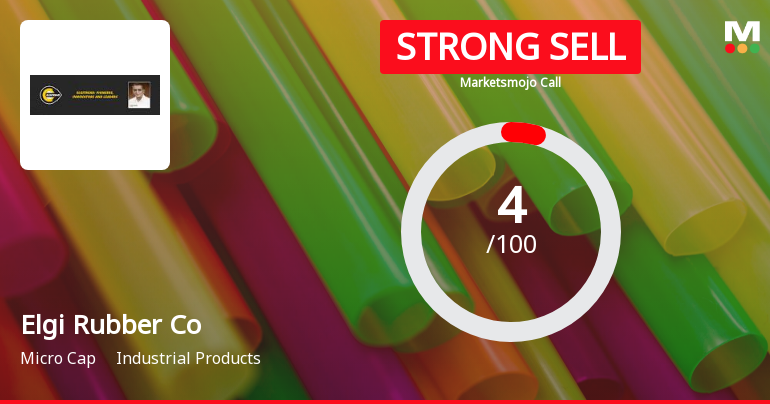
Elgi Rubber Company Ltd is Rated Strong Sell
Elgi Rubber Company Ltd is rated Strong Sell by MarketsMOJO, with this rating last updated on 29 May 2025. However, the analysis and financial metrics presented here reflect the company’s current position as of 04 July 2026, providing investors with an up-to-date view of its fundamentals, valuation, financial trends, and technical standing.
Read full news article Announcements
Elgi Rubber Company Limited - Updates
18-Nov-2019 | Source : NSEElgi Rubber Company Limited has informed the Exchange regarding 'Pursuant to Regulation 47(3) of SEBI (Listing Obligations and Disclosure Requirements) Regulations, 2015, we enclose copies of extract of unaudited financial results (standalone & consolidated) of the company for the quarter and half year ended 30th September 2019 published in Business Standard (English) and Malai Murasu (Tamil) on 15th November 2019.'.
Elgi Rubber Company Limited - Updates
17-Oct-2019 | Source : NSEElgi Rubber Company Limited has informed the Exchange regarding 'Certificate under Regulation 74(5) of SEBI (Depositories and Participants) Regulations, 2018, for the quarter ended 30th September 2019'.'.
Credit Rating
16-Sep-2019 | Source : NSE
| Elgi Rubber Company Limited has informed the Exchange regarding Credit Rating-Pursuant to Regulation 30 of the SEBI (Listing Obligations and Disclosure Requirements) Regulations, 2015, we wish to inform that the credit rating agency ICRA Limited has revised long term rating and short term rating as per their rationale attached. |
Corporate Actions

No Upcoming Board Meetings

Elgi Rubber Company Ltd has declared 16% dividend, ex-date: 18 Mar 20

No Splits history available

No Bonus history available

No Rights history available
Quality key factors
Valuation key factors
Technicals key factors
 Technical Indicator Scale: Bearish, Mildly Bearish, Sideways, Mildly Bullish, Bullish Turned
 Shareholding Snapshot : Mar 2026
Shareholding Compare (%holding)
Promoters
21.5055
Held by 2 Schemes (0.0%)
Held by 0 FIIs
Sudarsan Varadaraj (47.09%)
Tamilnadu Industrial Investment Corporation Limited (2.36%)
24.91%
Quarterly Results Snapshot (Consolidated) - Mar'26 - QoQ

QoQ Growth in quarter ended Mar 2026 is -13.74% vs 5.93% in Dec 2025
QoQ Growth in quarter ended Mar 2026 is -611.72% vs -377.04% in Dec 2025
Half Yearly Results Snapshot (Consolidated) - Sep'25
Growth in half year ended Sep 2025 is -7.76% vs -0.73% in Sep 2024
Growth in half year ended Sep 2025 is -146.53% vs 5.76% in Sep 2024
Nine Monthly Results Snapshot (Consolidated) - Dec'25
YoY Growth in nine months ended Dec 2025 is -2.28% vs -1.60% in Dec 2024
YoY Growth in nine months ended Dec 2025 is -385.86% vs -5.24% in Dec 2024
Annual Results Snapshot (Consolidated) - Mar'26
YoY Growth in year ended Mar 2026 is -4.54% vs -0.65% in Mar 2025
YoY Growth in year ended Mar 2026 is -5,410.09% vs -137.39% in Mar 2025
About Elgi Rubber Company Ltd

Company Coordinates


