
Compare Elin Electronics with Similar Stocks
Dashboard
Weak Long Term Fundamental Strength with a -12.11% CAGR growth in Operating Profits over the last 5 years
- The company has been able to generate a Return on Equity (avg) of 4.45% signifying low profitability per unit of shareholders funds
- PAT(Q) At Rs -0.76 cr has Fallen at -107.4% (vs previous 4Q average)
- INVENTORY TURNOVER RATIO(HY) Lowest at 7.85 times
- OPERATING PROFIT TO NET SALES(Q) Lowest at 1.84%
Falling Participation by Institutional Investors
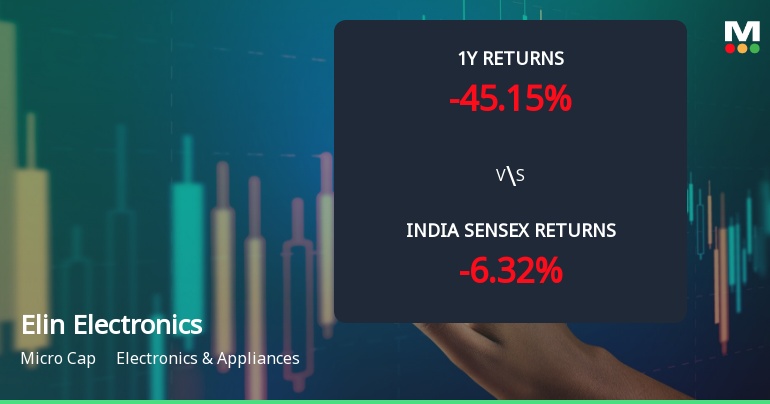
Consistent Underperformance against the benchmark over the last 3 years
Stock DNA
Electronics & Appliances
INR 547 Cr (Micro Cap)
22.00
55
0.00%
-0.13
4.18%
0.93
Total Returns (Price + Dividend) 
Latest dividend: 1.0006133088009812 per share ex-dividend date: Sep-22-2023
Risk Adjusted Returns v/s
Returns Beta

News
Elin Electronics Ltd Technical Momentum Shifts Amid Prolonged Downtrend
Elin Electronics Ltd, a micro-cap player in the Electronics & Appliances sector, has experienced a notable shift in its technical momentum, reflecting a complex interplay of bullish and bearish signals. Despite a modest daily price gain of 2.46%, the stock remains under pressure with a strong sell rating and deteriorating long-term returns compared to the broader Sensex.
Read full news article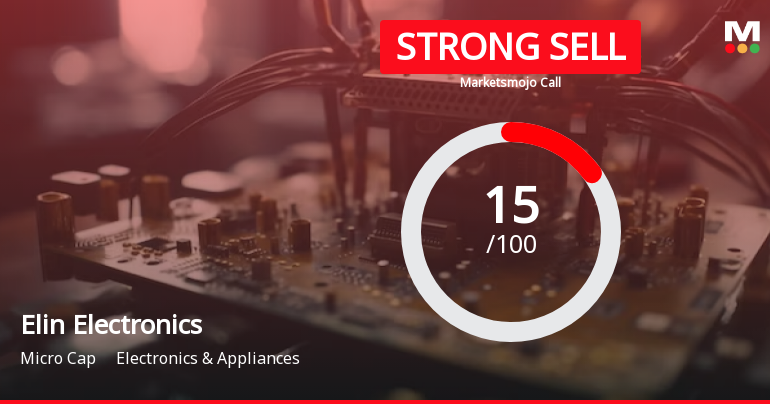
Elin Electronics Ltd is Rated Strong Sell
Elin Electronics Ltd is rated Strong Sell by MarketsMOJO, with this rating last updated on 17 June 2026. However, the analysis and financial metrics discussed here reflect the stock's current position as of 10 July 2026, providing investors with the most recent and relevant data to assess the company’s outlook.
Read full news article
Elin Electronics Ltd Faces Intensified Downtrend Amid Technical Deterioration
Elin Electronics Ltd, a micro-cap player in the Electronics & Appliances sector, has experienced a notable shift in its technical momentum, with key indicators signalling a bearish trend. The stock’s recent downgrade to a Strong Sell rating by MarketsMOJO, coupled with deteriorating price action and technical signals, underscores mounting challenges for investors amid a broader market context where the Sensex continues to outperform.
Read full news article Announcements
Corporate Actions

No Upcoming Board Meetings

Elin Electronics Ltd has declared 20% dividend, ex-date: 22 Sep 23

No Splits history available

No Bonus history available

No Rights history available
Quality key factors
Valuation key factors
Technicals key factors
 Technical Indicator Scale: Bearish, Mildly Bearish, Sideways, Mildly Bullish, Bullish Turned
 Shareholding Snapshot : Mar 2026
Shareholding Compare (%holding)
Non Institution
None
Held by 1 Schemes (3.49%)
Held by 8 FIIs (0.74%)
Kamal Sethia (9.21%)
Subhkam Ventures I Private Limited (3.98%)
48.98%
Quarterly Results Snapshot (Consolidated) - Mar'26 - QoQ

QoQ Growth in quarter ended Mar 2026 is 10.45% vs -21.63% in Dec 2025

QoQ Growth in quarter ended Mar 2026 is -120.77% vs -64.47% in Dec 2025
Half Yearly Results Snapshot (Consolidated) - Sep'25
Growth in half year ended Sep 2025 is 12.02% vs 13.46% in Sep 2024
Growth in half year ended Sep 2025 is 84.02% vs 39.14% in Sep 2024
Nine Monthly Results Snapshot (Consolidated) - Dec'25
YoY Growth in nine months ended Dec 2025 is 11.46% vs 13.17% in Dec 2024
YoY Growth in nine months ended Dec 2025 is 92.98% vs 17.13% in Dec 2024
Annual Results Snapshot (Consolidated) - Mar'26
YoY Growth in year ended Mar 2026 is 9.11% vs 13.29% in Mar 2025
YoY Growth in year ended Mar 2026 is -22.95% vs 111.39% in Mar 2025
About Elin Electronics Ltd

Company Coordinates


