
Compare Emami Paper with Similar Stocks
Dashboard
Low ability to service debt as the company has a high Debt to EBITDA ratio of 4.17 times
- Low ability to service debt as the company has a high Debt to EBITDA ratio of 4.17 times
Poor long term growth as Net Sales has grown by an annual rate of 9.41% and Operating profit at 3.13% over the last 5 years
With a growth in Net Profit of 85.4%, the company declared Very Positive results in Mar 26
With ROCE of 10.2, it has a Attractive valuation with a 1 Enterprise value to Capital Employed
Despite the size of the company, domestic mutual funds hold only 0% of the company
Stock DNA
Paper, Forest & Jute Products
INR 510 Cr (Micro Cap)
8.00
17
1.85%
1.42
10.80%
0.91
Total Returns (Price + Dividend) 
Latest dividend: 1.6 per share ex-dividend date: Aug-26-2025
Risk Adjusted Returns v/s
Returns Beta

News
Emami Paper Mills Ltd is Rated Hold by MarketsMOJO
Emami Paper Mills Ltd is rated 'Hold' by MarketsMOJO, a rating that was last updated on 28 April 2026. While this rating change reflects the company’s evolving outlook, the analysis and financial metrics presented here are based on the stock’s current position as of 12 June 2026, providing investors with the most up-to-date perspective on its fundamentals, valuation, financial trend, and technical standing.
Read full news article
Emami Paper Mills Ltd Technical Momentum Shifts Amid Mixed Market Signals
Emami Paper Mills Ltd has experienced a notable shift in its technical momentum, moving from a sideways trend to a mildly bearish stance, reflecting a complex interplay of technical indicators. Despite a recent downgrade in daily moving averages and monthly bearish signals, weekly momentum indicators suggest pockets of bullishness, presenting a nuanced outlook for investors navigating this micro-cap stock within the Paper, Forest & Jute Products sector.
Read full news article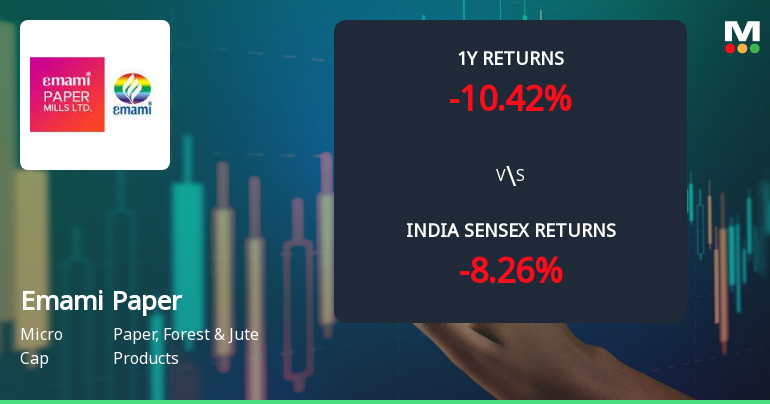
Emami Paper Mills Ltd Technical Momentum Shifts Signal Stabilising Outlook
Emami Paper Mills Ltd has experienced a notable shift in its technical momentum, moving from a mildly bearish stance to a sideways trend, reflecting a complex interplay of bullish and bearish signals across key indicators. Despite a modest day gain of 1.19%, the stock’s technical landscape reveals a nuanced outlook for investors navigating the Paper, Forest & Jute Products sector.
Read full news article Announcements
Emami Paper Mills Limited - Updates
08-Nov-2019 | Source : NSEEmami Paper Mills Limited has informed the Exchange regarding 'Publication of Unaudited Financial Results for the 2nd Quarter and Half Year ended 30th September 2019
Emami Paper Mills Limited - Updates
18-Oct-2019 | Source : NSEEmami Paper Mills Limited has informed the Exchange regarding 'Public Notice regarding the Board Meeting to be held on 07th November 2019'.
Emami Paper Mills Limited - Updates
17-Oct-2019 | Source : NSEEmami Paper Mills Limited has informed the Exchange regarding 'Intimation of Board Meeting, scheduled to be held Thursday, on 7th November 2019.'.
Corporate Actions

No Upcoming Board Meetings

Emami Paper Mills Ltd has declared 80% dividend, ex-date: 26 Aug 25

No Splits history available

No Bonus history available

No Rights history available
Quality key factors
Valuation key factors
Technicals key factors
 Technical Indicator Scale: Bearish, Mildly Bearish, Sideways, Mildly Bullish, Bullish Turned
 Shareholding Snapshot : Mar 2026
Shareholding Compare (%holding)
Promoters
None
Held by 0 Schemes
Held by 3 FIIs (0.53%)
Diwakar Finvest Private Limited (27.03%)
Bpc Tradecom Private Limited (4.58%)
11.38%
Quarterly Results Snapshot (Standalone) - Mar'26 - QoQ

QoQ Growth in quarter ended Mar 2026 is -0.81% vs 11.06% in Dec 2025
QoQ Growth in quarter ended Mar 2026 is 85.40% vs 158.21% in Dec 2025
Half Yearly Results Snapshot (Standalone) - Sep'25
Growth in half year ended Sep 2025 is -8.85% vs 4.56% in Sep 2024
Growth in half year ended Sep 2025 is -36.78% vs 15.00% in Sep 2024
Nine Monthly Results Snapshot (Standalone) - Dec'25
YoY Growth in nine months ended Dec 2025 is -2.91% vs -1.18% in Dec 2024

YoY Growth in nine months ended Dec 2025 is 35.26% vs -61.31% in Dec 2024
Annual Results Snapshot (Standalone) - Mar'26
YoY Growth in year ended Mar 2026 is -1.08% vs -3.30% in Mar 2025
YoY Growth in year ended Mar 2026 is 135.99% vs -69.15% in Mar 2025
About Emami Paper Mills Ltd

Company Coordinates


