
Compare Emami Realty Ltd with Similar Stocks
Dashboard
With a Negative Book Value, the company has a Weak Long Term Fundamental Strength
- Poor long term growth as Net Sales has grown by an annual rate of -23.85% and Operating profit at 0% over the last 5 years
- High Debt Company with a Debt to Equity ratio (avg) at 0 times
Flat results in Sep 25
Risky - Negative EBITDA
Stock DNA
Realty
INR 343 Cr (Micro Cap)
NA (Loss Making)
38
0.00%
-13.09
128.15%
-2.39
Total Returns (Price + Dividend) 
Emami Realty Ltd for the last several years.
Risk Adjusted Returns v/s
Returns Beta

News

Emami Realty Ltd is Rated Strong Sell
Emami Realty Ltd is rated Strong Sell by MarketsMOJO. This rating was last updated on 13 Oct 2025, reflecting a significant reassessment of the stock’s outlook. However, all fundamentals, returns, and financial metrics discussed below are current as of 14 January 2026, providing investors with the latest comprehensive view of the company’s position.
Read full news article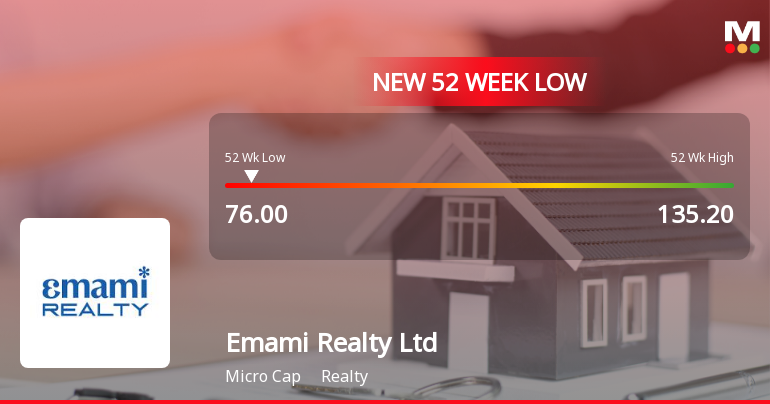
Emami Realty Ltd Falls to 52-Week Low Amidst Continued Downtrend
Emami Realty Ltd’s shares declined to a fresh 52-week low of Rs.76.05 on 12 Jan 2026, marking a significant milestone in the stock’s ongoing downward trajectory. The stock’s recent performance reflects persistent pressures amid a challenging market environment and subdued financial metrics.
Read full news article
Emami Realty Ltd is Rated Strong Sell
Emami Realty Ltd is rated Strong Sell by MarketsMOJO, with this rating last updated on 13 Oct 2025. However, the analysis and financial metrics discussed here reflect the stock's current position as of 03 January 2026, providing investors with the latest insights into the company’s performance and outlook.
Read full news article Announcements
Emami Realty Limited - Shareholders meeting
22-Oct-2019 | Source : NSEEmami Realty Limited has informed the Exchange with copy of minutes of Annual General Meeting held on September 19, 2019
Emami Realty Limited - Updates
16-Oct-2019 | Source : NSEEmami Realty Limited has informed the Exchange regarding 'We confirm that the share certificates for dematerialization during the quarter ended 30th September, 2019 received by our Registrar & Transfer Agent, M/s. Maheshwari Datamatics Pvt. Ltd., 23, R. N. Mukherjee Road, 5th Floor, Kolkata-700001, have been cancelled and mutilated and the name of the depository has been substituted in the records as the Registered Owner of the shares.
Emami Realty Limited - Trading Window
09-Oct-2019 | Source : NSEEmami Realty Limited has informed the Exchange regarding the Trading Window closure pursuant to SEBI (Prohibition of Insider Trading) Regulations, 2015
Corporate Actions

No Upcoming Board Meetings

No Dividend history available

No Splits history available

No Bonus history available

No Rights history available
Quality key factors
Valuation key factors
Technicals key factors
 Technical Indicator Scale: Bearish, Mildly Bearish, Sideways, Mildly Bullish, Bullish Turned
 Shareholding Snapshot : Sep 2025
Shareholding Compare (%holding)
Promoters
None
Held by 0 Schemes
Held by 1 FIIs (0.04%)
Diwakar Finvest Private Limited (31.05%)
Bpc Tradecom Private Limited (2.23%)
20.32%
Quarterly Results Snapshot (Consolidated) - Sep'25 - QoQ

QoQ Growth in quarter ended Sep 2025 is 52.58% vs -56.00% in Jun 2025

QoQ Growth in quarter ended Sep 2025 is 30.04% vs 36.24% in Jun 2025
Half Yearly Results Snapshot (Consolidated) - Sep'25
Growth in half year ended Sep 2025 is 32.81% vs -42.24% in Sep 2024
Growth in half year ended Sep 2025 is -218.75% vs 24.10% in Sep 2024
Nine Monthly Results Snapshot (Consolidated) - Dec'24
YoY Growth in nine months ended Dec 2024 is 55.99% vs -36.99% in Dec 2023
YoY Growth in nine months ended Dec 2024 is 11.40% vs -125.25% in Dec 2023
Annual Results Snapshot (Consolidated) - Mar'25
YoY Growth in year ended Mar 2025 is 33.92% vs -36.08% in Mar 2024
YoY Growth in year ended Mar 2025 is -2.69% vs -218.22% in Mar 2024
About Emami Realty Ltd

Company Coordinates


