
Compare Emcure Pharma with Similar Stocks
Dashboard
High Management Efficiency with a high ROCE of 21.82%
Strong ability to service debt as the company has a low Debt to EBITDA ratio of 0.84 times
Healthy long term growth as Net Sales has grown by an annual rate of 15.40% and Operating profit at 16.32%
Flat results in Mar 26
With ROCE of 22.8, it has a Very Expensive valuation with a 5.6 Enterprise value to Capital Employed
Majority shareholders : Promoters
Market Beating Performance
Stock DNA
Pharmaceuticals & Biotechnology
INR 35,675 Cr (Small Cap)
36.00
34
0.17%
0.28
19.15%
6.86
Total Returns (Price + Dividend) 
Latest dividend: 2.9999999999999996 per share ex-dividend date: Aug-14-2025
Risk Adjusted Returns v/s
Returns Beta

News
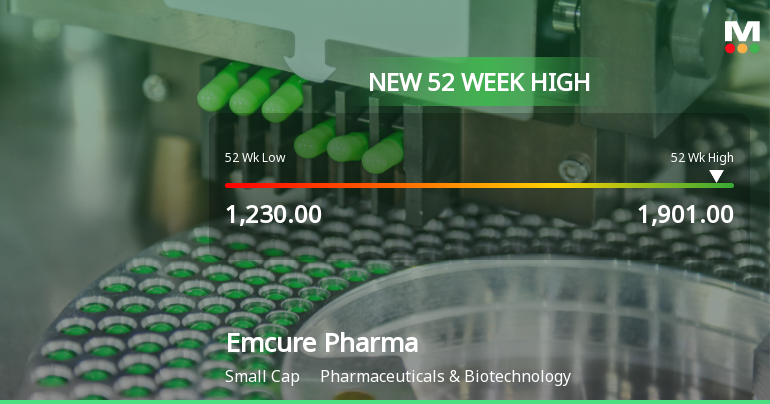
Broad-Based Technical Strength Lifts Emcure Pharmaceuticals Ltd to 52-Week High of Rs 1901
Surging past its previous peaks, Emcure Pharmaceuticals Ltd reached a fresh 52-week high of Rs 1901 on 23 Jun 2026, marking a significant milestone in its price journey. This advance comes amid a sustained four-day rally that has propelled the stock up by 9.42%, outpacing its sector by 3.71% on the day.
Read full news article

Emcure Pharmaceuticals Ltd is Rated Hold
Emcure Pharmaceuticals Ltd is rated 'Hold' by MarketsMOJO, with this rating last updated on 05 May 2026. However, the analysis and financial metrics discussed here reflect the stock's current position as of 22 June 2026, providing investors with the most up-to-date view of the company’s fundamentals, returns, and market performance.
Read full news article Announcements
Announcement under Regulation 30 (LODR)-Allotment of ESOP / ESPS
19-Jun-2026 | Source : BSEAllotment of 20600 Equity Shares pursuant to exercise of ESOPs under Emcure - Employee Stock Option Scheme 2013
Announcement under Regulation 30 (LODR)-Investor Presentation
12-Jun-2026 | Source : BSEIntimation under Regulation 30 of the SEBI (Listing Obligations and Disclosure Requirements) Regulations 2015 - Investor Presentation - June 2026
Compliances-Reg.24(A)-Annual Secretarial Compliance
27-May-2026 | Source : BSEAnnual Secretarial Compliance Report for the Financial Year ended March 31 2026
Corporate Actions

No Upcoming Board Meetings

Emcure Pharmaceuticals Ltd has declared 30% dividend, ex-date: 14 Aug 25

No Splits history available

No Bonus history available

No Rights history available
Quality key factors
Valuation key factors
Technicals key factors
 Technical Indicator Scale: Bearish, Mildly Bearish, Sideways, Mildly Bullish, Bullish Turned
 Shareholding Snapshot : Mar 2026
Shareholding Compare (%holding)
Promoters
0.0406
Held by 21 Schemes (4.94%)
Held by 95 FIIs (3.35%)
Satish R Mehta (39.77%)
Bc Investments Iv Limited (3.87%)
6.46%
Quarterly Results Snapshot (Consolidated) - Mar'26 - QoQ

QoQ Growth in quarter ended Mar 2026 is 4.49% vs 4.13% in Dec 2025
QoQ Growth in quarter ended Mar 2026 is 5.58% vs -5.31% in Dec 2025
Half Yearly Results Snapshot (Consolidated) - Sep'25

Growth in half year ended Sep 2025 is 14.49% vs 18.57% in Sep 2024
Growth in half year ended Sep 2025 is 33.00% vs 25.63% in Sep 2024
Nine Monthly Results Snapshot (Consolidated) - Dec'25
YoY Growth in nine months ended Dec 2025 is 16.51% vs 18.27% in Dec 2024
YoY Growth in nine months ended Dec 2025 is 38.30% vs 28.55% in Dec 2024
Annual Results Snapshot (Consolidated) - Mar'26
YoY Growth in year ended Mar 2026 is 16.56% vs 18.59% in Mar 2025
YoY Growth in year ended Mar 2026 is 35.67% vs 36.76% in Mar 2025
About Emcure Pharmaceuticals Ltd

Company Coordinates


