
Compare Emerald Finance with Similar Stocks
Stock DNA
Non Banking Financial Company (NBFC)
INR 180 Cr (Micro Cap)
12.00
20
0.00%
0.18
15.19%
1.90
Total Returns (Price + Dividend) 
Latest dividend: 0 per share ex-dividend date: Sep-23-2025
Risk Adjusted Returns v/s
Returns Beta

News
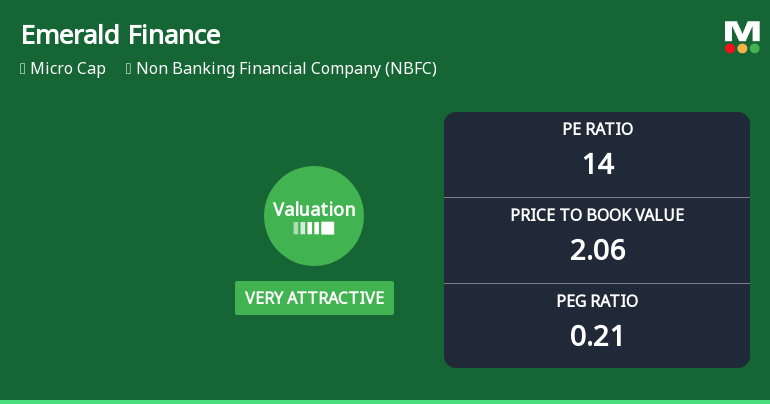
Emerald Finance Ltd Valuation Shifts Signal Renewed Price Attractiveness
Emerald Finance Ltd, a micro-cap player in the Non Banking Financial Company (NBFC) sector, has seen a notable shift in its valuation parameters, moving from an attractive to a very attractive rating. Despite a sharp decline in share price and a downgrade in its overall Mojo Grade to Sell, the company’s price-to-earnings (P/E) and price-to-book value (P/BV) ratios now present compelling value compared to peers and historical averages.
Read full news articleAre Emerald Finance Ltd latest results good or bad?
Emerald Finance Ltd has reported its Q4 FY26 financial results, showcasing significant operational trends. The company achieved consolidated net sales of ₹9.75 crores, reflecting a year-on-year growth of 51.16% and a quarter-on-quarter increase of 25.00%. This marks the seventh consecutive quarter of sequential revenue growth, indicating strong business momentum. The consolidated net profit for the same quarter stood at ₹4.05 crores, which represents a substantial year-on-year increase of 58.20% and a quarter-on-quarter rise of 5.47%. The profit after tax (PAT) margin was reported at 44.72%, demonstrating the company's effective conversion of revenue into profit, although this margin showed a slight decline from the previous quarter's exceptionally high level. Emerald Finance's operating profit margins, excluding other income, remained robust at 69.95%, though this was lower than the previous quarter's fi...
Read full news article
Emerald Finance Ltd is Rated Sell
Emerald Finance Ltd is rated Sell by MarketsMOJO, with this rating last updated on 25 Jun 2025. However, the analysis and financial metrics discussed here reflect the stock’s current position as of 29 May 2026, providing investors with an up-to-date view of the company’s fundamentals, valuation, financial trends, and technical outlook.
Read full news article Announcements
Announcement Under Regulation 30 Of LODR Regulations 2015
09-Jun-2026 | Source : BSESubmission of disclosure under Regulation 30 of LODR Regulations 2015
Disclosure Under Regulation 30(9) Of SEBI (Listing Obligations And Disclosure Requirements) Regulations 2015
05-Jun-2026 | Source : BSESubmission of disclosure under Regulation 30(9) of LODR Regulations 2015
Announcement under Regulation 30 (LODR)-Earnings Call Transcript
03-Jun-2026 | Source : BSESubmission of Earning Call Transcript
Corporate Actions

No Upcoming Board Meetings


No Splits history available

No Bonus history available

Emerald Finance Ltd has announced 42:19 rights issue, ex-date: 27 Jan 21
Quality key factors
Valuation key factors
Technicals key factors
 Technical Indicator Scale: Bearish, Mildly Bearish, Sideways, Mildly Bullish, Bullish Turned
 Shareholding Snapshot : Mar 2026
Shareholding Compare (%holding)
Promoters
None
Held by 0 Schemes
Held by 3 FIIs (1.78%)
Sanjay Aggarwal (32.38%)
Money Growth Investment Consultants Pvt Ltd (1.45%)
32.49%
Quarterly Results Snapshot (Consolidated) - Mar'26 - QoQ

QoQ Growth in quarter ended Mar 2026 is 25.00% vs 13.04% in Dec 2025

QoQ Growth in quarter ended Mar 2026 is 5.47% vs 6.67% in Dec 2025
Half Yearly Results Snapshot (Consolidated) - Sep'25
Growth in half year ended Sep 2025 is 44.89% vs 56.15% in Sep 2024
Growth in half year ended Sep 2025 is 80.11% vs 108.29% in Sep 2024
Nine Monthly Results Snapshot (Consolidated) - Dec'25
YoY Growth in nine months ended Dec 2025 is 41.67% vs 60.17% in Dec 2024
YoY Growth in nine months ended Dec 2025 is 70.08% vs 108.33% in Dec 2024
Annual Results Snapshot (Consolidated) - Mar'26
YoY Growth in year ended Mar 2026 is 44.51% vs 61.94% in Mar 2025
YoY Growth in year ended Mar 2026 is 71.65% vs 103.62% in Mar 2025
About Emerald Finance Ltd

Company Coordinates


