
Compare Emerald Leisures with Similar Stocks
Dashboard
With a Negative Book Value, the company has a Weak Long Term Fundamental Strength
- Poor long term growth as Net Sales has grown by an annual rate of 28.36% and Operating profit at 0% over the last 5 years
- The company has a negative book value of Rs 84.11 crore
Risky - Negative Book Value
Underperformed the market in the last 1 year
Stock DNA
Hotels & Resorts
INR 255 Cr (Micro Cap)
NA (Loss Making)
23
0.00%
-1.75
10.18%
-3.02
Total Returns (Price + Dividend) 
Emerald Leisures for the last several years.
Risk Adjusted Returns v/s
Returns Beta

News

Emerald Leisures Ltd is Rated Strong Sell
Emerald Leisures Ltd is rated Strong Sell by MarketsMOJO, with this rating last updated on 07 January 2026. However, the analysis and financial metrics discussed here reflect the stock’s current position as of 16 July 2026, providing investors with an up-to-date view of the company’s fundamentals, valuation, financial trends, and technical outlook.
Read full news article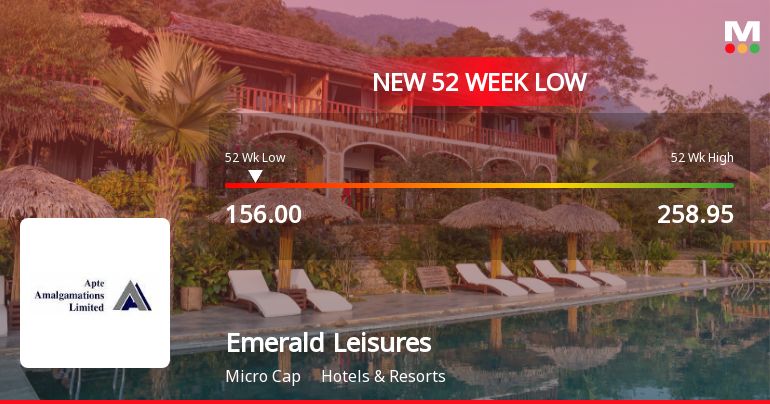

Emerald Leisures Ltd is Rated Strong Sell
Emerald Leisures Ltd is rated Strong Sell by MarketsMOJO, with this rating last updated on 07 January 2026. However, the analysis and financial metrics discussed here reflect the company’s current position as of 05 July 2026, providing investors with an up-to-date perspective on the stock’s fundamentals, valuation, financial trends, and technical outlook.
Read full news article Announcements
Compliances-Certificate under Reg. 74 (5) of SEBI (DP) Regulations 2018
06-Jul-2026 | Source : BSEWe are submitting herewith the certificate pursuant Regulation 74(5) of SEBI (DP) Regulations 2018
Announcement under Regulation 30 (LODR)-Newspaper Publication
02-Jul-2026 | Source : BSEPursuant to Regulation 30 and 47 of SEBI(LODR) Regulations 2015 we hereby submit copies of Public Notice published by way of advertisement in newspapers on 2nd July2026 in connection with the ensuing Annual General Meeting of the to be held on 23rd July2026.
Notice Of Shareholders Meeting
01-Jul-2026 | Source : BSENotice is hereby given that the 92nd Annual General Meeting of Emerald Leisures Limited will be held on Thursday July 232026 at 11:30 am through Video Conferencing / other Audio Visual. The Venue of the Meeting shall be deemed to be the registered office of the Company.
Corporate Actions

No Upcoming Board Meetings

No Dividend history available

Emerald Leisures Ltd has announced 5:10 stock split, ex-date: 24 May 21

No Bonus history available

Emerald Leisures Ltd has announced 2:1 rights issue, ex-date: 10 Sep 24
Quality key factors
Valuation key factors
Technicals key factors
 Technical Indicator Scale: Bearish, Mildly Bearish, Sideways, Mildly Bullish, Bullish Turned
 Shareholding Snapshot : Jun 2026
Shareholding Compare (%holding)
Promoters
18.7221
Held by 0 Schemes
Held by 0 FIIs
Jaydeep Vinod Mehta (31.13%)
Ayay Commodity Services Private Limited (8.47%)
13.21%
Quarterly Results Snapshot (Consolidated) - Mar'26 - YoY

YoY Growth in quarter ended Mar 2026 is 29.18% vs -4.07% in Mar 2025
YoY Growth in quarter ended Mar 2026 is 73.11% vs 9.16% in Mar 2025
Half Yearly Results Snapshot (Standalone) - Sep'25

Growth in half year ended Sep 2025 is -55.73% vs 125.56% in Mar 2025
Growth in half year ended Sep 2025 is 47.50% vs -81.82% in Mar 2025
Nine Monthly Results Snapshot (Standalone) - Dec'25
YoY Growth in nine months ended Dec 2025 is 3.18% vs -4.93% in Dec 2024
YoY Growth in nine months ended Dec 2025 is 5.94% vs -19.77% in Dec 2024
Annual Results Snapshot (Consolidated) - Mar'26
YoY Growth in year ended Mar 2026 is 10.13% vs -5.00% in Mar 2025
YoY Growth in year ended Mar 2026 is 20.74% vs -11.00% in Mar 2025
About Emerald Leisures Ltd

Company Coordinates


