
Compare Emergent Indust. with Similar Stocks
Dashboard
Weak Long Term Fundamental Strength with a -5.09% CAGR growth in Operating Profits over the last 5 years
- Company's ability to service its debt is weak with a poor EBIT to Interest (avg) ratio of -0.04
- The company has been able to generate a Return on Equity (avg) of 7.57% signifying low profitability per unit of shareholders funds
With ROE of 4.4, it has a Very Expensive valuation with a 6.6 Price to Book Value
Underperformed the market in the last 1 year
Stock DNA
Non - Ferrous Metals
INR 173 Cr (Micro Cap)
150.00
21
0.00%
-0.16
4.37%
6.27
Total Returns (Price + Dividend) 
Emergent Indust. for the last several years.
Risk Adjusted Returns v/s
Returns Beta

News
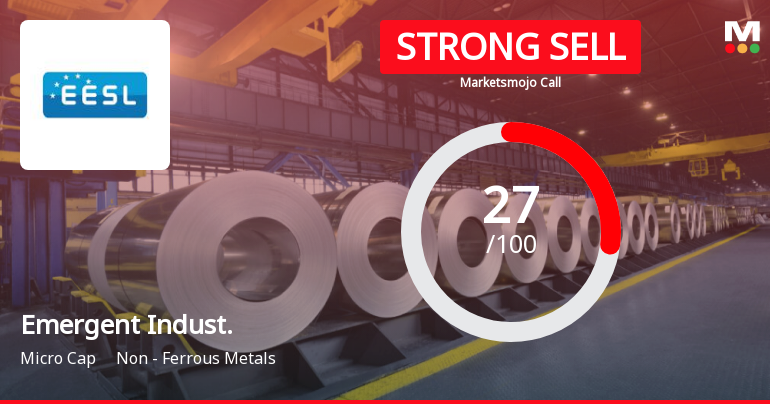
Emergent Industrial Solutions Ltd Downgraded to Strong Sell Amid Weak Fundamentals and Bearish Technicals
Emergent Industrial Solutions Ltd, a micro-cap player in the non-ferrous metals sector, has been downgraded from a Sell to a Strong Sell rating by MarketsMOJO as of 8 June 2026. This revision reflects deteriorating technical indicators, expensive valuation metrics, weak long-term financial trends, and subdued quality scores, signalling caution for investors amid recent volatility and underperformance relative to benchmarks.
Read full news article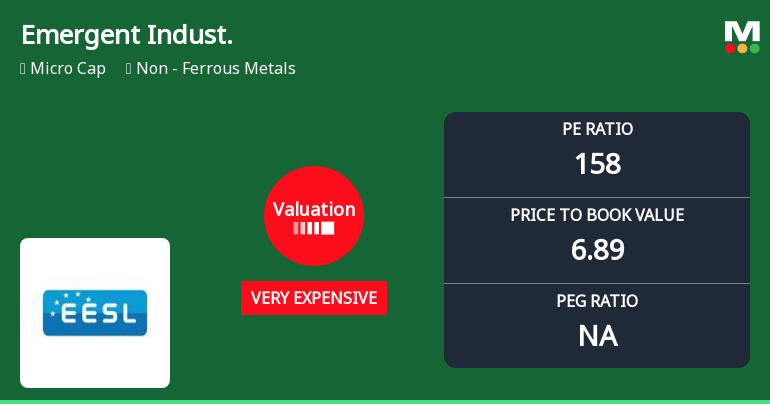
Emergent Industrial Solutions Ltd: Valuation Shifts Signal Elevated Price Risk
Emergent Industrial Solutions Ltd, a micro-cap player in the Non-Ferrous Metals sector, has seen a marked shift in its valuation parameters, moving from a risky to a very expensive rating. With a price-to-earnings (P/E) ratio soaring to 157.79 and a price-to-book value (P/BV) of 6.89, investors face heightened valuation risk amid subdued returns and a challenging sector backdrop.
Read full news article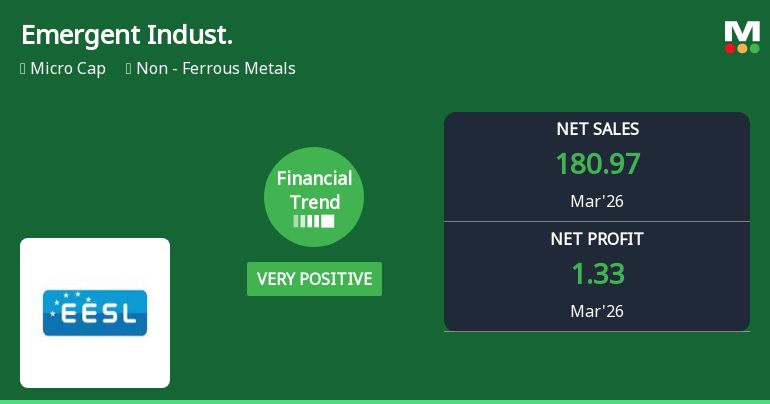
Emergent Industrial Solutions Ltd Reports Very Positive Quarterly Financial Performance Amid Micro-Cap Challenges
Emergent Industrial Solutions Ltd has demonstrated a remarkable financial turnaround in the quarter ended March 2026, posting its highest quarterly revenue and profit metrics in recent history. This significant improvement contrasts sharply with its previous performance trends and signals a potential shift in the company’s operational momentum within the non-ferrous metals sector.
Read full news article Announcements
Announcement under Regulation 30 (LODR)-Newspaper Publication
30-May-2026 | Source : BSEResults for year ended 31.3.2026 published in newspapers attached herewith
Compliances-Reg.24(A)-Annual Secretarial Compliance
29-May-2026 | Source : BSEAnnual Compliance report for year ended March 31 2026 is attached
Audited Financial Results (Standalone And Consolidated) For The Quarter And Year Ended 31St March 2026
29-May-2026 | Source : BSEAudited financial results (standalone and consolidated ) for the quarter and year ended 31st March 2026
Corporate Actions

No Upcoming Board Meetings

No Dividend history available

No Splits history available

No Bonus history available

No Rights history available
Quality key factors
Valuation key factors
Technicals key factors
 Technical Indicator Scale: Bearish, Mildly Bearish, Sideways, Mildly Bullish, Bullish Turned
 Shareholding Snapshot : Mar 2026
Shareholding Compare (%holding)
Promoters
None
Held by 0 Schemes
Held by 2 FIIs (9.3%)
Indo Powertech Limited (36.11%)
Alps Vyapar Pvt.ltd. (11.44%)
3.61%
Quarterly Results Snapshot (Consolidated) - Mar'26 - YoY

YoY Growth in quarter ended Mar 2026 is 284.55% vs -72.94% in Mar 2025
YoY Growth in quarter ended Mar 2026 is 223.15% vs -363.41% in Mar 2025
Half Yearly Results Snapshot (Consolidated) - Sep'25

Growth in half year ended Sep 2025 is -72.43% vs 3,439.26% in Sep 2024
Growth in half year ended Sep 2025 is -95.37% vs 2,058.33% in Sep 2024
Nine Monthly Results Snapshot (Consolidated) - Dec'25
YoY Growth in nine months ended Dec 2025 is -66.54% vs 309.06% in Dec 2024
YoY Growth in nine months ended Dec 2025 is -101.24% vs 273.08% in Dec 2024
Annual Results Snapshot (Consolidated) - Mar'26
YoY Growth in year ended Mar 2026 is -45.80% vs 123.04% in Mar 2025
YoY Growth in year ended Mar 2026 is -66.40% vs 121.05% in Mar 2025
About Emergent Industrial Solutions Ltd

Company Coordinates


