
Compare Emmbi Industries with Similar Stocks
Dashboard
Weak Long Term Fundamental Strength with an average Return on Capital Employed (ROCE) of 9.39%
- Poor long term growth as Net Sales has grown by an annual rate of 10.61% and Operating profit at 8.10% over the last 5 years
- Low ability to service debt as the company has a high Debt to EBITDA ratio of 4.06 times
Consistent Underperformance against the benchmark over the last 3 years
Total Returns (Price + Dividend) 
Latest dividend: 0.3 per share ex-dividend date: Sep-12-2025
Risk Adjusted Returns v/s
Returns Beta

News
Emmbi Industries Ltd is Rated Sell by MarketsMOJO
Emmbi Industries Ltd is rated Sell by MarketsMOJO. This rating was last updated on 11 May 2026, reflecting a shift from a previous 'Strong Sell' stance. However, the analysis and financial metrics discussed here represent the stock's current position as of 26 June 2026, providing investors with the latest insights into the company’s performance and outlook.
Read full news article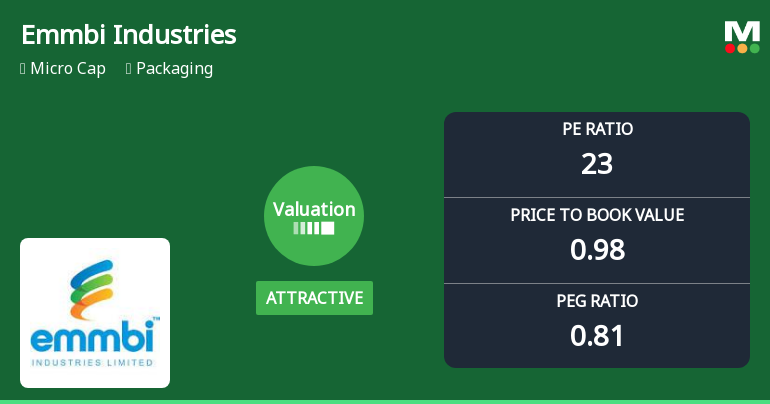
Emmbi Industries Ltd Valuation Improves Amid Market Rally
Emmbi Industries Ltd has witnessed a notable shift in its valuation parameters, moving from a very attractive to an attractive rating, signalling a change in price attractiveness that has caught the attention of investors. Despite a micro-cap status and a modest Mojo Score of 34.0 with a Sell grade, the stock’s recent price surge of over 10% in a single day reflects renewed market interest amid evolving valuation metrics.
Read full news article
Emmbi Industries Ltd is Rated Sell
Emmbi Industries Ltd is rated Sell by MarketsMOJO, with this rating last updated on 11 May 2026. However, the analysis and financial metrics discussed here reflect the company’s current position as of 15 June 2026, providing investors with the latest insights into its fundamentals, valuation, financial trends, and technical outlook.
Read full news article Announcements
Emmbi Industries Limited - Investor Presentation
14-Nov-2019 | Source : NSEEmmbi Industries Limited has informed the Exchange regarding Investor Presentation on the Un-Audited Financial Results of the Company for the Quarter and Half Year ended 30th September, 2019 which will be presented to Analysts/ Investors.
Emmbi Industries Limited - Shareholders meeting
25-Sep-2019 | Source : NSEEmmbi Industries Limited has informed the Exchange regarding Proceedings of Annual General Meeting held on September 25, 2019
AGM\/Book Closure
09-Sep-2019 | Source : NSE
| Emmbi Industries Limited has informed the Exchange that tthe Register of Members and the Share Transfer Books will remain closed from??September 19, 2019 to September 25, 2019?? ( both days incluisve) for the purpose of Annual General Meeting to be held on September 25, 2019?? and Dividend. |
Corporate Actions

No Upcoming Board Meetings

Emmbi Industries Ltd has declared 3% dividend, ex-date: 12 Sep 25

No Splits history available

No Bonus history available

No Rights history available
Quality key factors
Valuation key factors
Technicals key factors
 Technical Indicator Scale: Bearish, Mildly Bearish, Sideways, Mildly Bullish, Bullish Turned
 Shareholding Snapshot : Mar 2026
Shareholding Compare (%holding)
Promoters
None
Held by 0 Schemes
Held by 0 FIIs
Makarand Moreshwar Appalwar (19.96%)
Dheeraj Kumar Lohia (1.49%)
31.22%
Quarterly Results Snapshot (Standalone) - Mar'26 - QoQ

QoQ Growth in quarter ended Mar 2026 is 3.04% vs -8.34% in Dec 2025
QoQ Growth in quarter ended Mar 2026 is 104.42% vs -61.95% in Dec 2025
Half Yearly Results Snapshot (Standalone) - Sep'25
Growth in half year ended Sep 2025 is 16.80% vs 6.94% in Sep 2024
Growth in half year ended Sep 2025 is 45.03% vs 4.89% in Sep 2024
Nine Monthly Results Snapshot (Standalone) - Dec'25
YoY Growth in nine months ended Dec 2025 is 14.03% vs 9.24% in Dec 2024
YoY Growth in nine months ended Dec 2025 is 16.47% vs -8.46% in Dec 2024
Annual Results Snapshot (Standalone) - Mar'26
YoY Growth in year ended Mar 2026 is 12.24% vs 7.09% in Mar 2025
YoY Growth in year ended Mar 2026 is 22.69% vs -33.57% in Mar 2025
About Emmbi Industries Ltd

Company Coordinates


