Empire Inds.

  • Market Cap: Micro Cap
  • Industry: Diversified
  • ISIN: INE515H01014
  • NSEID: EMPIND
  • BSEID: 509525
INR
1,196.90
-12.3 (-1.02%)
BSENSE

Sep 02, 03:30 PM

BSE+NSE Vol: 450

  • Price Points
  • Score
  • Mojo Parameters
  • Total Return
  • News and Corporate Actions
  • Key factors
  • Shareholding
  • Financials
  • CompanyCV
stock-summaryPrice Point
High/Low

1Day

52 Week

Valuation
Technical
Day's Volume

CASH

450 (-57.54%) Volume

Shareholding (Jun 2026)

FII

0.00%

Held by 0 FIIs

DII

5.95%

Held by 1 DIIs

Promoter

72.55%

Why is Empire Industries Ltd falling/rising?

02-Sep-2026

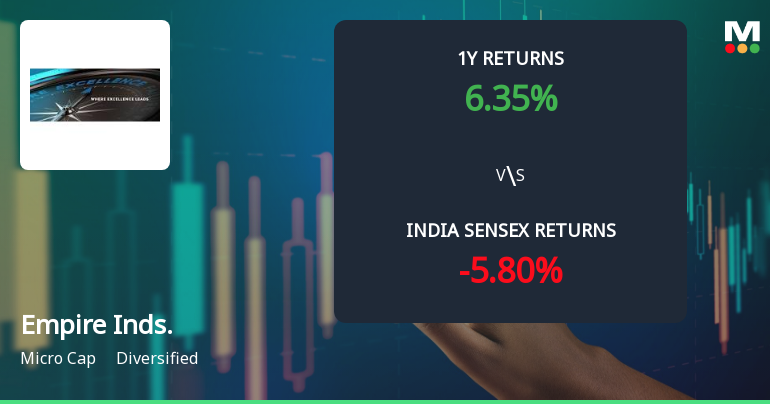
As of 01-Sep, Empire Industries Ltd's stock price is 1,207.85, down 0.54% over the past two days. Despite recent declines, the stock has increased 25.14% year-to-date, indicating strong long-term performance but current downward pressure.

As of 01-Sep, Empire Industries Ltd's stock price is currently at 1,207.85, reflecting a decrease of 6.55 points or 0.54%. The stock has been experiencing a consecutive decline over the past two days, with a total drop of 0.82% during this period. Additionally, it has underperformed its sector by 0.73% today. <BR><BR>Despite these recent declines, the stock has shown positive performance over longer periods, with a year-to-date increase of 25.14% compared to a 9.71% decline in the benchmark Sensex. Over the past month, the stock has risen by 13.03%, while the Sensex has fallen by 1.47%. However, the current price is still 4.48% away from its 52-week high of Rs 1260, indicating that while the stock has had strong performance in the past, it is currently facing downward pressure.<BR><BR>Investor participation appears to be rising, as evidenced by a 31.9% increase in delivery volume on August 31 compared to the 5-day average. This suggests that while the stock is experiencing a short-term decline, there may be underlying interest from investors. Overall, the combination of recent price drops, sector underperformance, and the stock's position relative to its moving averages contributes to the current falling trend.

View full answer

Who are in the management team of Empire Inds.?

01-Sep-2026

The management team of Empire Inds. includes S C Malhotra (Executive Chairman), Ranjit Malhotra (Vice Chairman & Managing Director), Dileep Malhotra (Joint Managing Director), and several independent directors, along with the Company Secretary. They are responsible for the company's strategic direction and governance.

The management team of Empire Inds. includes the following individuals:<BR><BR>1. **S C Malhotra** - Executive Chairman<BR>2. **Ranjit Malhotra** - Vice Chairman & Managing Director<BR>3. **Dileep Malhotra** - Joint Managing Director<BR>4. **Rajbir Singh** - Independent Director<BR>5. **Subodh Chandra** - Independent Director<BR>6. **Suhaschandra Nanda** - Company Secretary & Compliance Officer<BR>7. **Geetanjali Ram Naidu** - Independent Director<BR>8. **Kabir Malhotra** - Director<BR>9. **Anuja Mohe** - Independent Director<BR><BR>This team plays a crucial role in guiding the company's strategic direction and governance.

View full answer

What does Empire Inds. do?

01-Sep-2026

Empire Industries Ltd is a diversified micro-cap company involved in dyeing, crane fabrication, machine tool marketing, glass bottle manufacturing, and electronic instrumentation design. As of June 2026, it reported net sales of 184 Cr and a net profit of 14 Cr, with a market cap of INR 738 Cr.

Overview: <BR>Empire Industries Ltd is a diversified micro-cap company engaged in dyeing, designing and fabrication of cranes, marketing of machine tools, manufacturing of glass bottles, and designing of electronic instruments and instrumentation systems.<BR><BR>History: <BR>Empire Industries was originally established as The Empire Dyeing and Manufacturing Co and acquired its current name in 1975. The latest quarterly results reported net sales and profit for June 2026.<BR><BR>Financial Snapshot: <BR>Net Sales: 184 Cr (Quarterly Results - Jun 2026) <BR>Net Profit: 14 Cr (Quarterly Results - Jun 2026) <BR>Market Cap: INR 738 Cr (Micro Cap)<BR><BR>Key Metrics: <BR>P/E: 13.00 <BR>Industry P/E: 34 <BR>Dividend Yield: 2.05% <BR>Debt Equity: 0.15 <BR>Return on Equity: 16.05% <BR>Price to Book: 2.08 <BR><BR>Contact Details: <BR>Address: 414 Senapati Bapat Marg, Lower Parel Mumbai Maharashtra : 400013 <BR>Tel: 91-22-66555453 <BR>Email: email@empiresecretarial.com <BR>Website: http://www.empiremumbai.com

View full answer

Who are the peers of the Empire Inds.?

01-Sep-2026

Empire Inds. peers include Swan Corp, Sindhu Trade, Balmer Lawrie, TTK Healthcare, Dhunseri Vent., Panth Infinity, Krypton Industri, Galactico Corpo, and Aspinwall & Co. Management risk varies from excellent to below average among peers, with Panth Infinity showing the highest 1-year return at 27.42% and Swan Corp the lowest at -34.01%.

Peers: The peers of Empire Inds. are Swan Corp, Sindhu Trade, Balmer Lawrie, TTK Healthcare, Dhunseri Vent., Panth Infinity, Krypton Industri, Galactico Corpo., and Aspinwall & Co.<BR><BR>Quality Snapshot: Excellent management risk is observed at Sindhu Trade, Balmer Lawrie, TTK Healthcare, and Panth Infinity, while Average management risk is found at Empire Inds., Swan Corp, Dhunseri Vent., Aspinwall & Co, and the rest. Below Average management risk is noted at Krypton Industri and Galactico Corpo. Growth is Excellent at Panth Infinity, Average at Empire Inds., and Below Average at Swan Corp, Sindhu Trade, Balmer Lawrie, TTK Healthcare, Dhunseri Vent., Krypton Industri, Galactico Corpo, and Aspinwall & Co. Capital Structure is Excellent at Sindhu Trade, Balmer Lawrie, TTK Healthcare, and Panth Infinity, Good at Empire Inds. and Dhunseri Vent., and Below Average at Swan Corp, Krypton Industri, and Galactico Corpo.<BR><BR>Return Snapshot: The peer with the highest 1-year return is Panth Infinity at 27.42%, while the lowest is Swan Corp at -34.01%. Empire Inds. has a 1-year return of 7.19%, which is higher than Swan Corp but lower than Panth Infinity. Additionally, the peers Krypton Industri and Aspinwall & Co have negative six-month returns.

View full answer

How big is Empire Inds.?

01-Sep-2026

As of 31st August, Empire Industries Ltd has a market capitalization of 738.00 Cr and reported net sales of 747.99 Cr and net profit of 56.09 Cr over the latest four quarters.

As of 31st August, <BR><BR>Market Cap: Empire Industries Ltd has a market capitalization of 738.00 Cr, classified as a Micro Cap.<BR><BR>Recent Quarterly Performance: The sum of Net Sales for the latest 4 quarters is 747.99 Cr, while the sum of Net Profit for the same period is 56.09 Cr.<BR><BR>Balance Sheet Snapshot: The reporting period for the balance sheet is March 2025. Shareholder's Funds are valued at 314.06 Cr, and Total Assets amount to 750.92 Cr.

View full answer

Should I buy, sell or hold Empire Industries Ltd?

19-Aug-2026

Are Empire Industries Ltd latest results good or bad?

28-May-2026

Empire Industries Ltd's latest Q4 FY26 results are positive, showing a net profit of ₹18.95 crores, a 79.05% increase quarter-on-quarter and 326.80% year-on-year, alongside improved sales and operating margins. This strong performance indicates a favorable trajectory for the company, though future sustainability should be monitored.

Empire Industries Ltd's latest results for Q4 FY26 can be considered quite positive. The company achieved a net profit of ₹18.95 crores, marking a remarkable increase of 79.05% quarter-on-quarter and an impressive 326.80% year-on-year. This significant growth in profitability is complemented by a net sales figure of ₹195.37 crores, which reflects a 3.57% increase from the previous quarter and a 4.82% increase compared to the same quarter last year.<BR><BR>Furthermore, the operating margin improved substantially to 16.84%, up from 9.13% in the previous quarter, indicating strong operational efficiency and effective cost management. The profit after tax (PAT) margin also expanded to 9.70%, showcasing the company's ability to enhance profitability alongside revenue growth.<BR><BR>Overall, the results indicate a strong performance with record quarterly revenue and profit, driven by improved operational metrics and a favorable market environment. This performance suggests a positive trajectory for the company, although the sustainability of these improvements will be important to monitor in the coming quarters.

View full answer

Is Empire Inds. technically bullish or bearish?

25-Nov-2025

As of November 24, 2025, the technical trend is bearish with moderate strength, indicated by bearish MACD, Bollinger Bands, moving averages, and underperformance against the Sensex.

As of 24 November 2025, the technical trend has changed from mildly bearish to bearish. The current technical stance is bearish with moderate strength. Key indicators driving this stance include a bearish MACD on the weekly chart, bearish Bollinger Bands on both weekly and monthly time frames, and bearish moving averages on the daily chart. Additionally, the KST is bearish on the weekly and mildly bearish on the monthly, while Dow Theory indicates a mildly bearish trend on the weekly and monthly. The stock has also underperformed significantly compared to the Sensex over various periods, further supporting the bearish outlook.

View full answer

How has been the historical performance of Empire Inds.?

17-Nov-2025

Empire Inds. showed mixed historical performance, with net sales increasing to 676.97 Cr in Mar'25 but declines in profitability metrics, including operating profit and profit after tax. Total liabilities and assets rose, while cash flow from operating activities improved significantly.

Answer:<BR>The historical performance of Empire Inds. shows a mixed trend over the years with fluctuations in key financial metrics.<BR><BR>Breakdown:<BR>Empire Inds. reported net sales of 676.97 Cr in Mar'25, an increase from 606.02 Cr in Mar'24, but a slight decrease from 681.59 Cr in Mar'23. Total operating income followed a similar pattern, reaching 676.97 Cr in Mar'25, up from 606.02 Cr in the previous year. The total expenditure, excluding depreciation, increased to 607.31 Cr in Mar'25 from 541.87 Cr in Mar'24. Operating profit (PBDIT) was 84.52 Cr in Mar'25, down from 88.93 Cr in Mar'24, while profit before tax decreased to 40.01 Cr from 45.67 Cr. Profit after tax also saw a decline to 34.45 Cr in Mar'25 from 37.00 Cr in Mar'24. The company's total liabilities rose to 750.92 Cr in Mar'25 from 723.86 Cr in Mar'24, with total assets increasing to 750.92 Cr from 723.86 Cr. Cash flow from operating activities improved to 92.00 Cr in Mar'25 from 74.00 Cr in Mar'24, contributing to a net cash inflow of 49.00 Cr in Mar'25, up from 7.00 Cr in Mar'24. Overall, while Empire Inds. experienced growth in sales and cash flow, profitability metrics showed some decline in the latest fiscal year.

View full answer

Is Empire Inds. overvalued or undervalued?

13-Nov-2025

As of November 12, 2025, Empire Industries is considered very attractive and undervalued compared to peers, with a PE ratio of 17.93, an EV to EBITDA of 9.66, and a dividend yield of 2.26%, despite underperforming the Sensex year-to-date but achieving a strong 55.83% return over the past three years.

As of 12 November 2025, the valuation grade for Empire Industries has moved from attractive to very attractive, indicating a strong improvement in its perceived value. The company is currently considered undervalued, especially when compared to its peers. Key ratios include a PE ratio of 17.93, an EV to EBITDA of 9.66, and a dividend yield of 2.26%. <BR><BR>In comparison to its peers, Empire Industries stands out with a significantly lower PE ratio than Asahi India Glass, which is at 86.12, and Borosil Renewables, which has a PE ratio of 233.48. This suggests that Empire Industries offers a more favorable valuation relative to these competitors. Additionally, while the stock has underperformed the Sensex year-to-date, it has shown a strong return over the past three years at 55.83%, reinforcing its attractiveness as an investment opportunity.

View full answer

Who are the top shareholders of the Empire Inds.?

17-Jul-2025

The top shareholders of Empire Industries include Dileep Malhotra with 27.05%, Lici Asm Non Par at 5.95%, and individual investors holding 16.63%. There are no mutual funds or foreign institutional investors currently involved.

The top shareholders of Empire Industries include the promoters, with Dileep Malhotra holding the largest share at 27.05%. The highest public shareholder is Lici Asm Non Par, who owns 5.95%. Additionally, individual investors collectively hold 16.63% of the shares. There are currently no mutual funds or foreign institutional investors (FIIs) holding shares in the company.

View full answer

When is the next results date for Empire Inds.?

06-Jun-2025

No Upcoming Board Meetings

Has Empire Inds. declared dividend?

06-Jun-2025

Empire Industries Ltd has declared a 250% dividend, amounting to 25 per share, with an ex-date of September 13, 2024. The company has shown strong total returns over various periods, particularly a 110.98% total return over the past five years.

Empire Industries Ltd has declared a 250% dividend.<BR><BR>Dividend Details:<BR>- Percentage announced: 250%<BR>- Amount per share: 25<BR>- Ex-date: 13 Sep 24<BR><BR>Dividend Yield: 2.32%.<BR><BR>Total Returns by Period:<BR>In the last 6 months, the price return was -1.09%, with a dividend return of 0%, resulting in a total return of -1.09%.<BR><BR>Over the past year, the price return was 8.93%, the dividend return was 2.50%, leading to a total return of 11.43%.<BR><BR>In the 2-year period, the price return was 57.77%, the dividend return was 7.32%, resulting in a total return of 65.09%.<BR><BR>For the 3-year period, the price return was 59.59%, with a dividend return of 11.74%, culminating in a total return of 71.33%.<BR><BR>In the 4-year period, the price return was 31.18%, the dividend return was 12.88%, which gave a total return of 44.06%.<BR><BR>Lastly, over the 5-year period, the price return was 92.65%, the dividend return was 18.33%, leading to a total return of 110.98%.<BR><BR>Overall, Empire Industries Ltd has declared a substantial dividend, and the total returns over various periods indicate strong performance, particularly in the longer term, highlighting the company's growth and shareholder value enhancement.

View full answer
iScoreScore
Click here to find our call on this stock
Strong Sell
Sell
Hold
Buy
Strong Buy

Dashboard

1

Strong ability to service debt as the company has a low Debt to EBITDA ratio of 1.98 times

 
2

Positive results in Jun 26

3

With ROCE of 17.4, it has a Very Attractive valuation with a 1.9 Enterprise value to Capital Employed

4

Majority shareholders : Promoters

 
stock-summaryMojo Parameters

Mojo Parameters

Loading Valuation Snapshot...

Stock DNA

stock-summary
Industry

Diversified

stock-summary
Market cap

INR Cr (Micro Cap)

stock-summary
P/E

13.00

stock-summary
Industry P/E

NA

stock-summary
Dividend Yield

0.00%

stock-summary
Debt Equity

0.00

stock-summary
Return on Equity

0.00%

stock-summary
Price to Book

0.00

Revenue and Profits:
Net Sales:
184 Cr
(Quarterly Results - Jun 2026)
Net Profit:
14 Cr
stock-summaryTotal Returns
Total Returns (Price + Dividend) stock-summary
Icon
Company does not have enough history
Risk Adjusted Returns v/s stock-summary
Returns Beta
Icon
Beta has not been calculated since enough price history is not available
stock-summaryNews & Corporate Actions

News

stock-summaryKey Factors

Quality key factors stock-summary

Factor
Value
Sales Growth (5y)
8.64%
EBIT Growth (5y)
30.86%
EBIT to Interest (avg)
2.03
Debt to EBITDA (avg)
3.29
Net Debt to Equity (avg)
0.15
Sales to Capital Employed (avg)
1.29
Tax Ratio
16.27%
Dividend Payout Ratio
43.54%
Pledged Shares
0
Institutional Holding
5.95%
ROCE (avg)
13.04%
ROE (avg)
11.97%

Valuation key factors

Factor
Value
P/E Ratio
13
Industry P/E
34
Price to Book Value
2.03
EV to EBIT
10.30
EV to EBITDA
8.43
EV to Capital Employed
1.90
EV to Sales
1.03
PEG Ratio
0.20
Dividend Yield
2.10%
ROCE (Latest)
17.41%
ROE (Latest)
16.05%

Technicals key factors

Indicator
Weekly
Monthly
MACD
Bullish
Bullish
RSI
Bearish
No Signal
Bollinger Bands
Mildly Bullish
Mildly Bullish
Moving Averages
Bullish (Daily)
KST
Bullish
Bearish
Dow Theory
Mildly Bullish
No Trend
OBV
Bullish
No Trend
stock-summary Technical Indicator Scale: Bearish, Mildly Bearish, Sideways, Mildly Bullish, Bullish  Turned 
stock-summaryShareholding
Shareholding Snapshot : Jun 2026stock-summary
Shareholding Compare (%holding) stock-summary
Majority shareholders

Promoters

Pledged Promoter Holdings

None

Mutual Funds

Held by 0 Schemes

FIIs

Held by 0 FIIs

Promoter with highest holding

Dileep Malhotra (27.05%)

Highest Public shareholder

Lici Asm Non Par (5.95%)

Individual Investors Holdings

15.77%

stock-summaryFinancial
[
  {
    "link": "quarterly",
    "btn_text": "All Quarterly Results",
    "header": "Quarterly Results Snapshot (Standalone) - Jun'26 - YoY",
    "rhs": [
      {
        "prefix": "Net Sales ",
        "suffix": "YoY Growth in quarter ended Jun 2026 is 10.07% vs 9.98% in Jun 2025",
        "dir": 1
      },
      {
        "prefix": "Standalone Net Profit ",
        "suffix": "YoY Growth in quarter ended Jun 2026 is 47.30% vs -0.72% in Jun 2025",
        "dir": 1
      }
    ],
    "table": {
      "header": [
        "Jun'26",
        "Jun'25",
        "Change(%)"
      ],
      "body": [
        {
          "field": "Net Sales",
          "val1": "183.60",
          "val2": "166.80",
          "chgp": "10.07%",
          "chgp_class": "positive"
        },
        {
          "field": "Operating Profit (PBDIT) excl Other Income",
          "val1": "19.76",
          "val2": "15.46",
          "chgp": "27.81%",
          "chgp_class": "positive"
        },
        {
          "field": "Interest",
          "val1": "4.60",
          "val2": "4.69",
          "chgp": "-1.92%",
          "chgp_class": "positive"
        },
        {
          "field": "Exceptional Items",
          "val1": "0.00",
          "val2": "0.00",
          "chgp": "",
          "chgp_class": "neutral"
        },
        {
          "field": "Standalone Net Profit",
          "val1": "14.17",
          "val2": "9.62",
          "chgp": "47.30%",
          "chgp_class": "positive"
        },
        {
          "field": "Operating Profit Margin (Excl OI)",
          "val1": "10.76%",
          "val2": "9.27%",
          "chgp": "1.49%",
          "chgp_class": "positive"
        }
      ]
    }
  },
  {
    "link": "half-yearly",
    "btn_text": "All Half Yearly Results",
    "header": "Half Yearly Results Snapshot (Standalone) - Sep'25",
    "rhs": [
      {
        "prefix": "Net Sales ",
        "suffix": " Growth in half year ended Sep 2025 is 10.19% vs 4.62% in Sep 2024",
        "dir": 1
      },
      {
        "prefix": "Standalone Net Profit ",
        "suffix": " Growth in half year ended Sep 2025 is 12.93% vs 37.45% in Sep 2024",
        "dir": -1
      }
    ],
    "table": {
      "header": [
        "Sep'25",
        "Sep'24",
        "Change(%)"
      ],
      "body": [
        {
          "field": "Net Sales",
          "val1": "347.18",
          "val2": "315.08",
          "chgp": "10.19%",
          "chgp_class": "positive"
        },
        {
          "field": "Operating Profit (PBDIT) excl Other Income",
          "val1": "36.59",
          "val2": "35.67",
          "chgp": "2.58%",
          "chgp_class": "positive"
        },
        {
          "field": "Interest",
          "val1": "12.61",
          "val2": "12.36",
          "chgp": "2.02%",
          "chgp_class": "negative"
        },
        {
          "field": "Exceptional Items",
          "val1": "0.00",
          "val2": "0.00",
          "chgp": "",
          "chgp_class": "neutral"
        },
        {
          "field": "Standalone Net Profit",
          "val1": "22.01",
          "val2": "19.49",
          "chgp": "12.93%",
          "chgp_class": "positive"
        },
        {
          "field": "Operating Profit Margin (Excl OI)",
          "val1": "10.54%",
          "val2": "11.32%",
          "chgp": "-0.78%",
          "chgp_class": "negative"
        }
      ]
    }
  },
  {
    "link": "nine-monthly",
    "btn_text": "All Nine Monthly Results",
    "header": "Nine Monthly Results Snapshot (Standalone) - Dec'25",
    "rhs": [
      {
        "prefix": "Net Sales ",
        "suffix": "YoY Growth in nine months ended Dec 2025 is 9.22% vs 8.05% in Dec 2024",
        "dir": 1
      },
      {
        "prefix": "Standalone Net Profit ",
        "suffix": "YoY Growth in nine months ended Dec 2025 is 8.60% vs 22.99% in Dec 2024",
        "dir": -1
      }
    ],
    "table": {
      "header": [
        "Dec'25",
        "Dec'24",
        "Change(%)"
      ],
      "body": [
        {
          "field": "Net Sales",
          "val1": "535.82",
          "val2": "490.58",
          "chgp": "9.22%",
          "chgp_class": "positive"
        },
        {
          "field": "Operating Profit (PBDIT) excl Other Income",
          "val1": "53.82",
          "val2": "53.58",
          "chgp": "0.45%",
          "chgp_class": "positive"
        },
        {
          "field": "Interest",
          "val1": "18.57",
          "val2": "19.36",
          "chgp": "-4.08%",
          "chgp_class": "positive"
        },
        {
          "field": "Exceptional Items",
          "val1": "0.00",
          "val2": "0.00",
          "chgp": "",
          "chgp_class": "neutral"
        },
        {
          "field": "Standalone Net Profit",
          "val1": "32.59",
          "val2": "30.01",
          "chgp": "8.60%",
          "chgp_class": "positive"
        },
        {
          "field": "Operating Profit Margin (Excl OI)",
          "val1": "10.04%",
          "val2": "10.92%",
          "chgp": "-0.88%",
          "chgp_class": "negative"
        }
      ]
    }
  },
  {
    "link": "annual",
    "btn_text": "All Annual Results",
    "header": "Annual Results Snapshot (Standalone) - Mar'26",
    "rhs": [
      {
        "prefix": "Net Sales ",
        "suffix": "YoY Growth in year ended Mar 2026 is 8.01% vs 11.71% in Mar 2025",
        "dir": -1
      },
      {
        "prefix": "Standalone Net Profit ",
        "suffix": "YoY Growth in year ended Mar 2026 is 49.64% vs -6.89% in Mar 2025",
        "dir": 1
      }
    ],
    "table": {
      "header": [
        "Mar'26",
        "Mar'25",
        "Change(%)"
      ],
      "body": [
        {
          "field": "Net Sales",
          "val1": "731.20",
          "val2": "676.97",
          "chgp": "8.01%",
          "chgp_class": "positive"
        },
        {
          "field": "Operating Profit (PBDIT) excl Other Income",
          "val1": "86.73",
          "val2": "69.66",
          "chgp": "24.50%",
          "chgp_class": "positive"
        },
        {
          "field": "Interest",
          "val1": "28.26",
          "val2": "27.27",
          "chgp": "3.63%",
          "chgp_class": "negative"
        },
        {
          "field": "Exceptional Items",
          "val1": "-0.41",
          "val2": "0.00",
          "chgp": "",
          "chgp_class": "neutral"
        },
        {
          "field": "Standalone Net Profit",
          "val1": "51.55",
          "val2": "34.45",
          "chgp": "49.64%",
          "chgp_class": "positive"
        },
        {
          "field": "Operating Profit Margin (Excl OI)",
          "val1": "11.86%",
          "val2": "10.29%",
          "chgp": "1.57%",
          "chgp_class": "positive"
        }
      ]
    }
  }
]

Quarterly Results Snapshot (Standalone) - Jun'26 - YoYstock-summary

Jun'26
Jun'25
Change(%)
Net Sales
183.60
166.80
10.07%
Operating Profit (PBDIT) excl Other Income
19.76
15.46
27.81%
Interest
4.60
4.69
-1.92%
Exceptional Items
0.00
0.00
Standalone Net Profit
14.17
9.62
47.30%
Operating Profit Margin (Excl OI)
10.76%
9.27%
1.49%
Values in Rs Cr.
Direction Arrows
Net Sales

YoY Growth in quarter ended Jun 2026 is 10.07% vs 9.98% in Jun 2025

Direction Arrows
Standalone Net Profit

YoY Growth in quarter ended Jun 2026 is 47.30% vs -0.72% in Jun 2025

Half Yearly Results Snapshot (Standalone) - Sep'25stock-summary

Sep'25
Sep'24
Change(%)
Net Sales
347.18
315.08
10.19%
Operating Profit (PBDIT) excl Other Income
36.59
35.67
2.58%
Interest
12.61
12.36
2.02%
Exceptional Items
0.00
0.00
Standalone Net Profit
22.01
19.49
12.93%
Operating Profit Margin (Excl OI)
10.54%
11.32%
-0.78%
Values in Rs Cr.
Direction Arrows
Net Sales

Growth in half year ended Sep 2025 is 10.19% vs 4.62% in Sep 2024

Direction Arrows
Standalone Net Profit

Growth in half year ended Sep 2025 is 12.93% vs 37.45% in Sep 2024

Nine Monthly Results Snapshot (Standalone) - Dec'25stock-summary

Dec'25
Dec'24
Change(%)
Net Sales
535.82
490.58
9.22%
Operating Profit (PBDIT) excl Other Income
53.82
53.58
0.45%
Interest
18.57
19.36
-4.08%
Exceptional Items
0.00
0.00
Standalone Net Profit
32.59
30.01
8.60%
Operating Profit Margin (Excl OI)
10.04%
10.92%
-0.88%
Values in Rs Cr.
Direction Arrows
Net Sales

YoY Growth in nine months ended Dec 2025 is 9.22% vs 8.05% in Dec 2024

Direction Arrows
Standalone Net Profit

YoY Growth in nine months ended Dec 2025 is 8.60% vs 22.99% in Dec 2024

Annual Results Snapshot (Standalone) - Mar'26stock-summary

Mar'26
Mar'25
Change(%)
Net Sales
731.20
676.97
8.01%
Operating Profit (PBDIT) excl Other Income
86.73
69.66
24.50%
Interest
28.26
27.27
3.63%
Exceptional Items
-0.41
0.00
Standalone Net Profit
51.55
34.45
49.64%
Operating Profit Margin (Excl OI)
11.86%
10.29%
1.57%
Values in Rs Cr.
Direction Arrows
Net Sales

YoY Growth in year ended Mar 2026 is 8.01% vs 11.71% in Mar 2025

Direction Arrows
Standalone Net Profit

YoY Growth in year ended Mar 2026 is 49.64% vs -6.89% in Mar 2025

stock-summaryCompany CV
About Empire Industries Ltd stock-summary
stock-summary
Empire Industries Ltd
Micro Cap
Diversified
Empire Industries Ltd. formerly established as The Empire Dyeing and Manufacturing Co, Empire Industries acquired its present name in 1975. It is a multi-faceted company engaged in activities like dyeing, designing and fabrication of medium and heavy duty cranes, marketing of machine tools, manufacture of glass bottles and designing of electronic instruments and instrumentation systems.
Company Coordinates stock-summary
Company Details
414 Senapati Bapat Marg, Lower Parel Mumbai Maharashtra : 400013
stock-summary
Tel: 91-22-66555453
stock-summary
email@empiresecretarial.com
Registrar Details
Bigshare Services Pvt Ltd , E-2 , Ansa Industrial Estate, Saki Vihar Road, Saki Naka, Andheri (E), Mumbai