
Compare EMS with Similar Stocks
Dashboard
Poor long term growth as Net Sales has grown by an annual rate of -3.86% and Operating profit at -18.78% over the last 5 years
With a fall in Operating Profit of -35.74%, the company declared Very Negative results in Mar 26
With ROE of 8.6, it has a Expensive valuation with a 1.6 Price to Book Value
Despite the size of the company, domestic mutual funds hold only 0% of the company
Below par performance in long term as well as near term
Stock DNA
Other Utilities
INR 1,658 Cr (Small Cap)
18.00
34
0.50%
0.09
8.58%
1.56
Total Returns (Price + Dividend) 
Latest dividend: 1.5 per share ex-dividend date: Sep-19-2025
Risk Adjusted Returns v/s
Returns Beta

News

EMS Ltd is Rated Strong Sell
EMS Ltd is rated Strong Sell by MarketsMOJO. This rating was last updated on 01 June 2026, reflecting a reassessment of the stock’s outlook. However, all fundamentals, returns, and financial metrics discussed here are current as of 12 June 2026, providing investors with the latest view of the company’s position.
Read full news article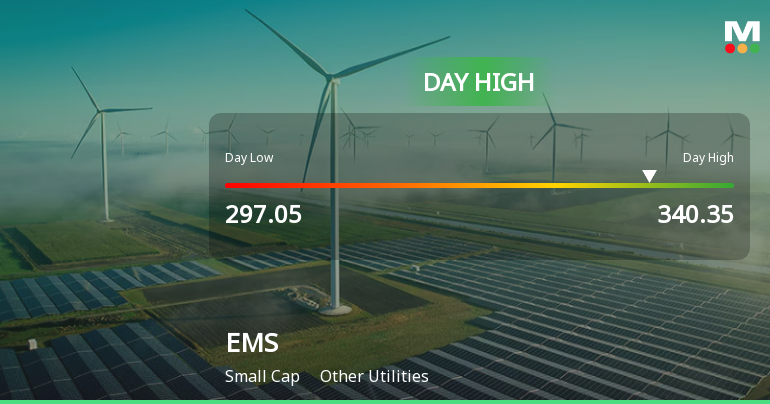
EMS Ltd Surges 11.63% to Day's High of Rs 329.15 — Outperforms Sector by 12.9 Percentage Points
The Sensex declined by 0.92% on 08 Jun 2026 while EMS Ltd surged 11.63%, outperforming its sector by 12.9 percentage points. This sharp single-session gain stands out amid a broadly weak market, signalling a stock-specific event rather than a general market uplift.
Read full news article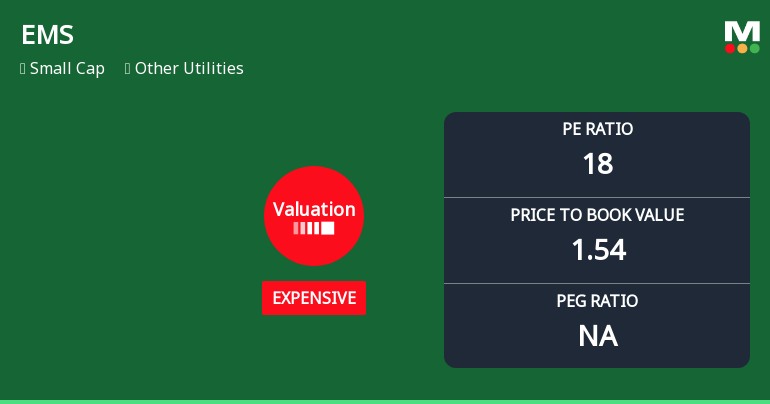
EMS Ltd Valuation Shifts to Expensive Amid Steep Price Decline
EMS Ltd has witnessed a marked shift in its valuation parameters, moving from an attractive to an expensive rating, reflecting growing investor caution amid a steep price decline. The company’s price-to-earnings (P/E) ratio now stands at 17.91, signalling a premium relative to its historical averages and peer group, while its price-to-book value (P/BV) has risen to 1.54. These changes come against a backdrop of significant stock underperformance and deteriorating market sentiment.
Read full news article Announcements
Intimation Of Receipt Of Lowest Bidder (L-1) Status Awarded By UP Jal Nigam (Urban) Varanasi
06-Jun-2026 | Source : BSEIntimation of Receipt of Lowest Bidder (L-1) Status Awarded by UP Jal Nigam (Urban) Varanasi for construction work Laying and Jointing of Sewer Network and providing Sewer House Connection
Announcement under Regulation 30 (LODR)-Earnings Call Transcript
03-Jun-2026 | Source : BSETranscript of Earnings Conference Call held on Saturday May 30 2026
Announcement under Regulation 30 (LODR)-Newspaper Publication
30-May-2026 | Source : BSENewspaper Publication relating to Audited Standalone and Consolidated Financial Results of the company for the Quarter and Financial Year ended March 31 2026
Corporate Actions

No Upcoming Board Meetings

EMS Ltd has declared 15% dividend, ex-date: 19 Sep 25

No Splits history available

No Bonus history available

No Rights history available
Quality key factors
Valuation key factors
Technicals key factors
 Technical Indicator Scale: Bearish, Mildly Bearish, Sideways, Mildly Bullish, Bullish Turned
 Shareholding Snapshot : Mar 2026
Shareholding Compare (%holding)
Promoters
21.9452
Held by 1 Schemes (0.0%)
Held by 8 FIIs (0.41%)
Ramveer Singh (67.85%)
None
25.89%
Quarterly Results Snapshot (Consolidated) - Mar'26 - QoQ

QoQ Growth in quarter ended Mar 2026 is -39.86% vs 15.49% in Dec 2025
QoQ Growth in quarter ended Mar 2026 is -70.31% vs -33.32% in Dec 2025
Half Yearly Results Snapshot (Consolidated) - Sep'25
Growth in half year ended Sep 2025 is -6.46% vs 26.19% in Sep 2024
Growth in half year ended Sep 2025 is -23.80% vs 27.70% in Sep 2024
Nine Monthly Results Snapshot (Consolidated) - Dec'25
YoY Growth in nine months ended Dec 2025 is -10.70% vs 25.00% in Dec 2024
YoY Growth in nine months ended Dec 2025 is -38.11% vs 30.39% in Dec 2024
Annual Results Snapshot (Consolidated) - Mar'26
YoY Growth in year ended Mar 2026 is -24.65% vs 22.59% in Mar 2025
YoY Growth in year ended Mar 2026 is -50.68% vs 20.45% in Mar 2025
About EMS Ltd

Company Coordinates


