
Compare Enbee Trade with Similar Stocks
Stock DNA
Diversified Commercial Services
INR 58 Cr (Micro Cap)
4.00
21
0.98%
0.59
13.70%
0.64
Total Returns (Price + Dividend) 
Latest dividend: 0.01 per share ex-dividend date: Jun-26-2025
Risk Adjusted Returns v/s
Returns Beta

News
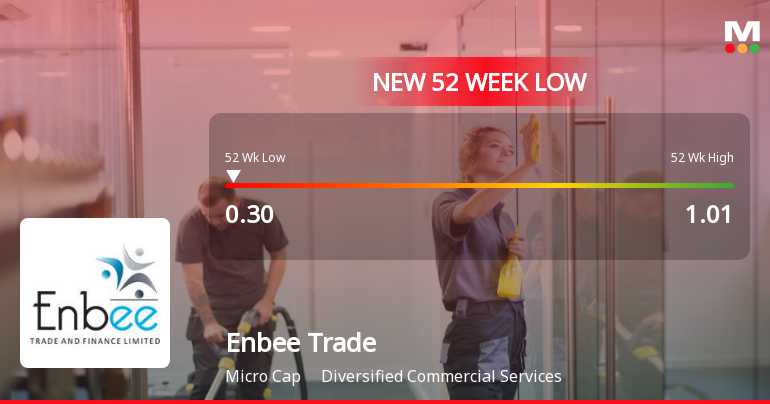
Enbee Trade & Finance Ltd Falls to 52-Week Low of Rs 0.3 as Sell-Off Deepens
For the fifth consecutive session, Enbee Trade & Finance Ltd closed lower, slipping to a fresh 52-week low of Rs 0.3 on 19 Jun 2026, marking a steep 68.37% decline over the past year despite a backdrop of rising profits.
Read full news article
Enbee Trade & Finance Ltd Falls to 52-Week Low of Rs 0.31 as Sell-Off Deepens
For the fifth consecutive session, Enbee Trade & Finance Ltd closed lower, slipping to a fresh 52-week low of Rs 0.31 on 18 Jun 2026. This decline contrasts sharply with the broader market, where the Sensex gained 0.14% to trade above 77,000 points, underscoring the stock's persistent underperformance.
Read full news article
Enbee Trade & Finance Ltd is Rated Sell
Enbee Trade & Finance Ltd is rated 'Sell' by MarketsMOJO, with this rating last updated on 04 Aug 2025. However, the analysis and financial metrics discussed here reflect the stock's current position as of 17 June 2026, providing investors with an up-to-date view of the company’s fundamentals, valuation, financial trends, and technical outlook.
Read full news article Announcements
Disclosure In Terms Of Regulation 29(2) Of Securities And Exchange Board Of India (Substantial Acquisition Of Shares And Takeovers) Regulations 2011- MEYHUL GAALA
17-Jun-2026 | Source : BSEEnclosed
Disclosure In Terms Of Regulation 29(2) Of Securities And Exchange Board Of India (Substantial Acquisition Of Shares And Takeovers) Regulations 2011- BHARATHI NARENDRA GALA
17-Jun-2026 | Source : BSEEnclosed
Reporting Under Regulation 7(1)(B) Of The Securities And Exchange Board Of India (Prohibition Of Insider Trading) Regulations 2015-MEYHUL GAALA
17-Jun-2026 | Source : BSEEnclosed
Corporate Actions

No Upcoming Board Meetings

Enbee Trade & Finance Ltd has declared 1% dividend, ex-date: 26 Jun 25

Enbee Trade & Finance Ltd has announced 1:10 stock split, ex-date: 11 Apr 25

No Bonus history available

Enbee Trade & Finance Ltd has announced 21:10 rights issue, ex-date: 04 Mar 26
Quality key factors
Valuation key factors
Technicals key factors
 Technical Indicator Scale: Bearish, Mildly Bearish, Sideways, Mildly Bullish, Bullish Turned
 Shareholding Snapshot : Mar 2026
Shareholding Compare (%holding)
Non Institution
None
Held by 0 Schemes
Held by 0 FIIs
Narendra Bhavanji Gala Huf (8.5%)
Devaraj Backiaraj (2.38%)
87.75%
Quarterly Results Snapshot (Standalone) - Mar'26 - YoY

YoY Growth in quarter ended Mar 2026 is 18.21% vs 90.34% in Mar 2025

YoY Growth in quarter ended Mar 2026 is 140.85% vs 86.36% in Mar 2025
Half Yearly Results Snapshot (Standalone) - Sep'25
Growth in half year ended Sep 2025 is 78.12% vs 82.86% in Sep 2024
Growth in half year ended Sep 2025 is 109.64% vs 37.57% in Sep 2024
Nine Monthly Results Snapshot (Standalone) - Dec'25
YoY Growth in nine months ended Dec 2025 is 74.21% vs 93.61% in Dec 2024
YoY Growth in nine months ended Dec 2025 is 158.61% vs 386.76% in Dec 2024
Annual Results Snapshot (Standalone) - Mar'26
YoY Growth in year ended Mar 2026 is 55.20% vs 92.49% in Mar 2025
YoY Growth in year ended Mar 2026 is 152.93% vs 217.31% in Mar 2025
About Enbee Trade & Finance Ltd

Company Coordinates


