
Compare Endurance Tech with Similar Stocks
Stock DNA
Auto Components & Equipments
INR 38,974 Cr (Mid Cap)
39.00
37
0.37%
-0.08
14.14%
5.58
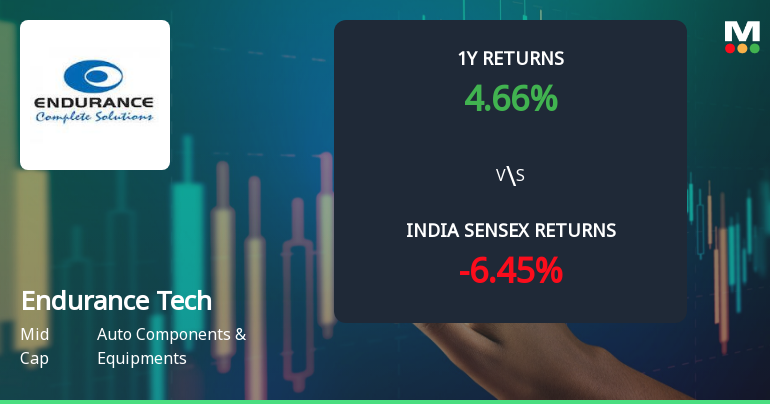
Total Returns (Price + Dividend) 
Latest dividend: 10 per share ex-dividend date: Aug-01-2025
Risk Adjusted Returns v/s
Returns Beta

News
Endurance Technologies Ltd. Shows Mildly Bullish Momentum Amid Technical Shifts
Endurance Technologies Ltd., a prominent player in the Auto Components & Equipments sector, has exhibited a notable shift in its technical momentum, moving from a sideways trend to a mildly bullish stance. This transition is underscored by a mixed but generally positive set of technical indicators, including MACD, Bollinger Bands, and Dow Theory signals, which suggest cautious optimism for investors amid a mid-cap market capitalisation environment.
Read full news article
Endurance Technologies Ltd. is Rated Hold
Endurance Technologies Ltd. is rated 'Hold' by MarketsMOJO, with this rating last updated on 07 May 2026. However, the analysis and financial metrics discussed here reflect the stock's current position as of 21 June 2026, providing investors with the most up-to-date view of the company’s fundamentals and market performance.
Read full news article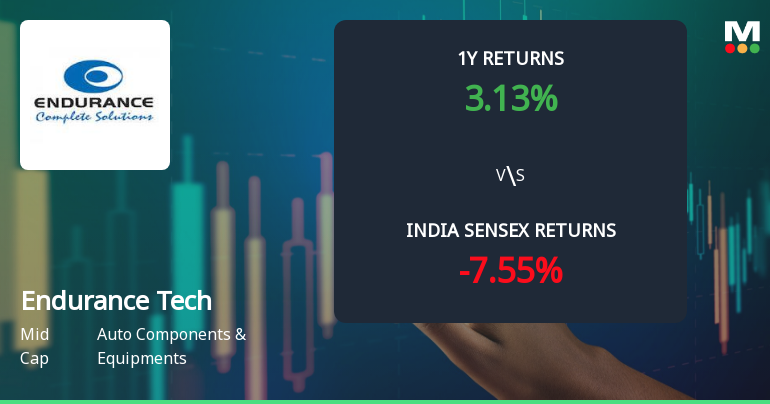
Endurance Technologies Ltd. Technical Momentum Shifts Amid Mixed Indicators
Endurance Technologies Ltd., a mid-cap player in the Auto Components & Equipments sector, has witnessed a notable shift in its technical momentum, moving from a mildly bearish stance to a more sideways trend. Recent technical indicators present a complex picture, with bullish signals emerging on weekly charts while monthly data remains cautiously mixed, prompting investors to reassess the stock’s near-term trajectory amid broader market dynamics.
Read full news article Announcements
Announcement under Regulation 30 (LODR)-Restructuring
24-Jun-2026 | Source : BSEEndurance Technologies Limited has announced the exchange about sale of a wholly-owned step-down subsidiary of the Company in Italy
Announcement under Regulation 30 (LODR)-Change in Management
23-Jun-2026 | Source : BSEEndurance Technologies Limited has informed the exchange about change in management of the Company with the elevation of Ms. Preety Raj Chief Human Resources Officer to the President cadre (Senior Management Personnel).
Capacity Addition For Manufacturing Lithium-Ion Battery Packs
18-Jun-2026 | Source : BSECapacity addition for manufacturing of Lithium-Ion Battery packs at the Companys existing manufacturing facility at Mindewadi Pune.
Corporate Actions

No Upcoming Board Meetings

Endurance Technologies Ltd. has declared 115% dividend, ex-date: 31 Jul 26

No Splits history available

No Bonus history available

No Rights history available
Quality key factors
Valuation key factors
Technicals key factors
 Technical Indicator Scale: Bearish, Mildly Bearish, Sideways, Mildly Bullish, Bullish Turned
 Shareholding Snapshot : Mar 2026
Shareholding Compare (%holding)
Promoters
None
Held by 31 Schemes (6.08%)
Held by 185 FIIs (13.14%)
Anurang Jain (30.85%)
Government Of Singapore (5.33%)
1.69%
Quarterly Results Snapshot (Consolidated) - Mar'26 - YoY

YoY Growth in quarter ended Mar 2026 is 37.88% vs 10.38% in Mar 2025

YoY Growth in quarter ended Mar 2026 is 12.78% vs 16.65% in Mar 2025
Half Yearly Results Snapshot (Consolidated) - Sep'25
Growth in half year ended Sep 2025 is 20.28% vs 14.88% in Sep 2024
Growth in half year ended Sep 2025 is 11.50% vs 27.91% in Sep 2024
Nine Monthly Results Snapshot (Consolidated) - Dec'25
YoY Growth in nine months ended Dec 2025 is 22.25% vs 13.78% in Dec 2024
YoY Growth in nine months ended Dec 2025 is 14.21% vs 25.70% in Dec 2024
Annual Results Snapshot (Consolidated) - Mar'26
YoY Growth in year ended Mar 2026 is 26.25% vs 12.89% in Mar 2025
YoY Growth in year ended Mar 2026 is 13.79% vs 22.90% in Mar 2025
About Endurance Technologies Ltd.

Company Coordinates


