
Compare ENEOS Holdings, Inc. with Similar Stocks
Dashboard
1
High Debt Company with a Debt to Equity ratio (avg) at times
- Poor long term growth as Operating profit has grown by an annual rate 42.38% of over the last 5 years
- High Debt Company with a Debt to Equity ratio (avg) at times
2
Healthy long term growth as Net Sales has grown by an annual rate of 4.24%
3
The company declared very negative results in Mar'25 after flat results in Dec'24
4
Risky -
5
Majority shareholders : FIIs
6
Consistent Returns over the last 3 years
Total Returns (Price + Dividend) 
TimePeriod
Price Return
Dividend Return
Total Return
3 Months
39363.28%
0%
39363.28%
6 Months
39093.38%
0%
39093.38%
1 Year
31293.26%
0%
31293.26%
2 Years
20844.53%
0%
20844.53%
3 Years
24846.43%
0%
24846.43%
4 Years
39363.28%
0%
39363.28%
5 Years
34825.0%
0%
34825.0%
ENEOS Holdings, Inc. for the last several years.
Risk Adjusted Returns v/s
News
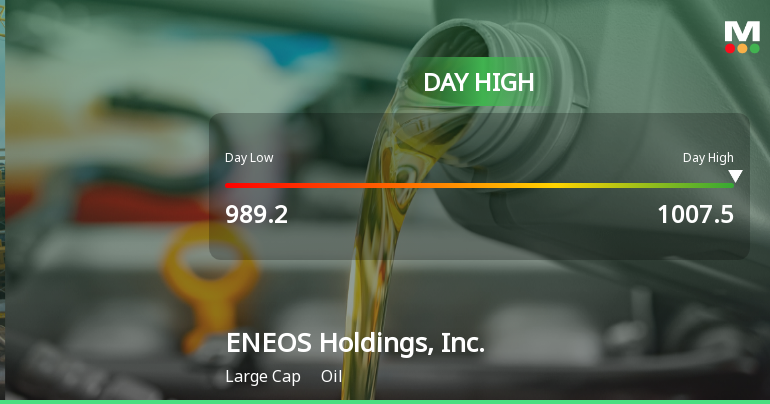
ENEOS Holdings Hits Day High with Strong 3.06% Intraday Surge
ENEOS Holdings, Inc. saw a significant rise in its stock today, contrasting with a decline in the Japan Nikkei 225. Over the past week and month, ENEOS has demonstrated resilience, although it faces challenges such as a high debt-to-equity ratio and declining net sales. The company's market capitalization is JPY 2,411,188 million.
Read full news article Announcements

No announcement available
Corporate Actions
No corporate action available
Quality key factors
Factor
Value
Sales Growth (5y)
4.24%
EBIT Growth (5y)
42.38%
EBIT to Interest (avg)
10.54
Debt to EBITDA (avg)
3.03
Net Debt to Equity (avg)
0.50
Sales to Capital Employed (avg)
2.23
Tax Ratio
39.27%
Dividend Payout Ratio
32.52%
Pledged Shares
0
Institutional Holding
0.13%
ROCE (avg)
7.58%
ROE (avg)
10.94%
Valuation key factors
Factor
Value
P/E Ratio
32
Industry P/E
Price to Book Value
0.60
EV to EBIT
14.03
EV to EBITDA
6.61
EV to Capital Employed
0.73
EV to Sales
0.28
PEG Ratio
NA
Dividend Yield
NA
ROCE (Latest)
5.23%
ROE (Latest)
1.85%
Technicals key factors
Indicator
Weekly
Monthly
MACD
Bullish
Bullish
RSI
No Signal
No Signal
Bollinger Bands
Bullish
Bullish
Moving Averages
Bullish (Daily)
KST
Bullish
Bullish
Dow Theory
Bullish
Bullish
OBV
Bullish
Bullish
 Technical Indicator Scale: Bearish, Mildly Bearish, Sideways, Mildly Bullish, Bullish Turned
 Shareholding Snapshot : Sep 2025
Shareholding Compare (%holding)
Majority shareholders
Foreign Institutions
Domestic Funds
Held in 0 Schemes (0%)
Foreign Institutions
Held by 2 Foreign Institutions (0.13%)
Strategic Entities with highest holding
Highest Public shareholder
Quarterly Results Snapshot (Consolidated) - Jun'25 - QoQ
Jun'25
Mar'25
Change(%)
Net Sales
2,869,974.00
2,716,556.00
5.65%
Operating Profit (PBDIT) excl Other Income
52,131.00
120,539.00
-56.75%
Interest
10,867.00
3,381.00
221.41%
Exceptional Items
0.00
0.00
Consolidate Net Profit
5,330.00
-154,334.00
103.45%
Operating Profit Margin (Excl OI)
-10.10%
10.50%
-2.06%
USD in Million.

Net Sales
QoQ Growth in quarter ended Jun 2025 is 5.65% vs -16.61% in Mar 2025
Consolidated Net Profit
QoQ Growth in quarter ended Jun 2025 is 103.45% vs -233.30% in Mar 2025
Annual Results Snapshot (Consolidated) - Mar'25
Mar'25
Mar'24
Change(%)
Net Sales
12,322,494.00
12,344,557.00
-0.18%
Operating Profit (PBDIT) excl Other Income
608,278.00
650,541.00
-6.50%
Interest
41,495.00
37,850.00
9.63%
Exceptional Items
-197,517.00
-49,269.00
-300.90%
Consolidate Net Profit
57,352.00
229,409.00
-75.00%
Operating Profit Margin (Excl OI)
19.70%
25.60%
-0.59%
USD in Million.
Net Sales
YoY Growth in year ended Mar 2025 is -0.18% vs -17.79% in Mar 2024

Consolidated Net Profit
YoY Growth in year ended Mar 2025 is -75.00% vs 13.02% in Mar 2024
About ENEOS Holdings, Inc.

ENEOS Holdings, Inc.
Oil
No Details Available.
Company Coordinates
No Company Details Available
InfinHub Market Technologies FZ-LLC, Building-2, Unit 112, Dubai Internet City, Dubai, United Arab Emirates
GET THE MARKETSMOJO APP


Company
Stocks
Portfolio


"Investment in securities markets are subject to market risk. Read all the related documents carefully before investing."