
Compare Energizer Holdings, Inc. with Similar Stocks
Dashboard
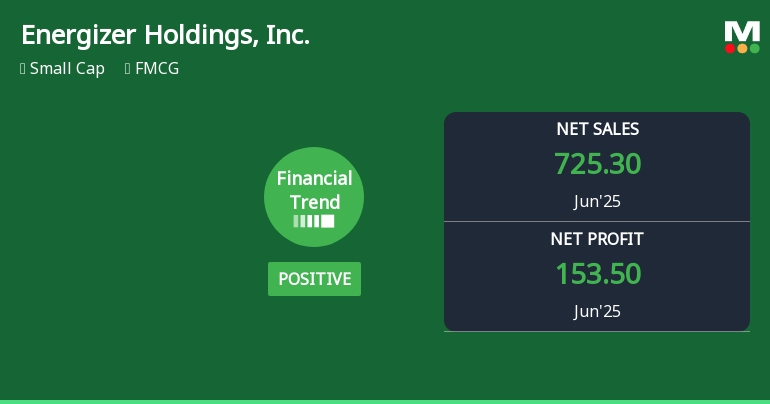
Flat results in Jun 25
- OPERATING CASH FLOW(Y) Lowest at USD 254.5 MM
- INVENTORY TURNOVER RATIO(HY) Lowest at 2.2 times
With ROCE of 13.98%, it has a very expensive valuation with a 1.51 Enterprise value to Capital Employed
Consistent Underperformance against the benchmark over the last 3 years
Total Returns (Price + Dividend) 
Energizer Holdings, Inc. for the last several years.
Risk Adjusted Returns v/s
News
Energizer Holdings, Inc. Experiences Revision in Stock Evaluation Amid Strong Financial Metrics
Energizer Holdings, Inc. reported strong financial results for the quarter ending June 2025, with notable metrics including a return on capital employed of 164.19% and an operating profit of USD 249.7 million. However, challenges persist in operating cash flow and inventory turnover, alongside significant declines in market performance.
Read full news article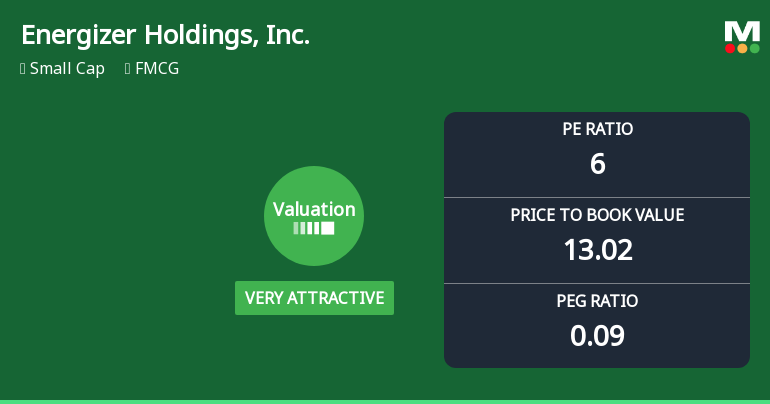
Energizer Holdings, Inc. Experiences Revision in Its Stock Evaluation Amidst Market Challenges
Energizer Holdings, Inc. has recently adjusted its valuation, showcasing a low P/E ratio of 6 and a PEG ratio of 0.09, suggesting a favorable valuation relative to growth. Despite facing significant performance challenges, its high dividend yield of 492.11% may attract income-focused investors in the competitive FMCG sector.
Read full news article
Energizer Holdings Hits New 52-Week Low at $17.13
Energizer Holdings, Inc. has reached a new 52-week low, trading at USD 17.13 as of November 20, 2025. The company, operating in the FMCG sector, has seen a 37.17% decline in stock value over the past year, despite strong financial metrics and high institutional holdings.
Read full news article Announcements

Corporate Actions
Quality key factors
Valuation key factors
Technicals key factors
 Technical Indicator Scale: Bearish, Mildly Bearish, Sideways, Mildly Bullish, Bullish Turned
 Shareholding Snapshot : Sep 2025
Shareholding Compare (%holding)
Domestic Funds
Held in 73 Schemes (57.62%)
Held by 122 Foreign Institutions (7.28%)
Quarterly Results Snapshot (Consolidated) - Sep'25 - QoQ

QoQ Growth in quarter ended Sep 2025 is 14.82% vs 9.41% in Jun 2025

QoQ Growth in quarter ended Sep 2025 is -77.26% vs 442.40% in Jun 2025
Annual Results Snapshot (Consolidated) - Sep'25
YoY Growth in year ended Sep 2025 is 2.28% vs -2.46% in Sep 2024
YoY Growth in year ended Sep 2025 is 527.30% vs -72.88% in Sep 2024
About Energizer Holdings, Inc.

Company Coordinates


