Engineers India

  • Market Cap: Small Cap
  • Industry: Construction
  • ISIN: INE510A01028
  • NSEID: ENGINERSIN
  • BSEID: 532178
INR
240.55
-1.75 (-0.72%)
BSENSE

Aug 07, 03:30 PM

BSE+NSE Vol: 12.99 lacs

  • Price Points
  • Score
  • Mojo Parameters
  • Total Return
  • News and Corporate Actions
  • Key factors
  • Shareholding
  • Financials
  • CompanyCV
stock-summaryPrice Point
High/Low

1Day

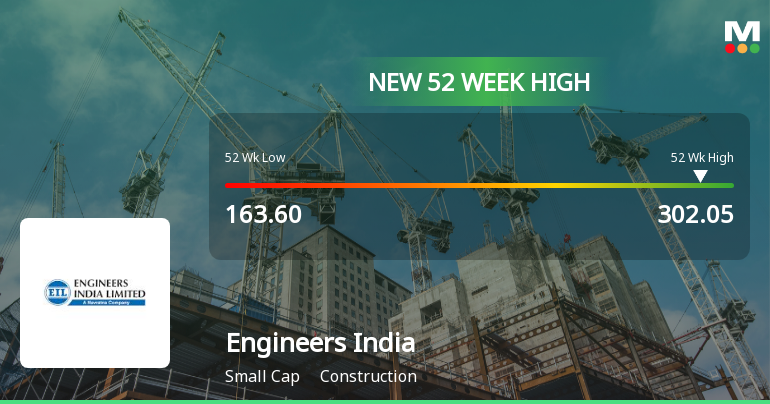
52 Week

Valuation
Technical
Day's Volume

CASH

12.99 lacs (-63.19%) Volume

Shareholding (Jun 2026)

FII

9.17%

Held by 156 FIIs

DII

14.26%

Held by 44 DIIs

Promoter

51.32%

Why is Engineers India Ltd. falling/rising?

09-Aug-2026

As of 08-Aug, Engineers India Ltd. is experiencing a stock price decline to 240.55, reflecting a -0.72% change. Despite this short-term drop, the stock has strong long-term performance with a year-to-date increase of 19.44% and high management efficiency, although concerns about long-term growth and valuation remain.

As of 08-Aug, Engineers India Ltd. is experiencing a decline in its stock price, currently at 240.55, which reflects a change of -1.75 (-0.72%). This drop comes after a brief period of gains, as the stock has fallen following two consecutive days of increases. Despite this recent downturn, the stock has shown strong performance over the longer term, with a year-to-date increase of 19.44% and a one-year return of 18.44%, significantly outperforming the broader market.<BR><BR>The stock's current performance indicates it has underperformed its sector by 0.85% today. However, it is noteworthy that Engineers India Ltd. is trading above its moving averages across various time frames, suggesting a generally positive trend in the longer term. Additionally, there has been a significant increase in investor participation, with delivery volume rising by 88.31% compared to the five-day average, indicating growing interest in the stock.<BR><BR>On the positive side, the company boasts high management efficiency with a return on equity (ROE) of 17.80% and is net-debt free, which are attractive factors for investors. The latest financial results show a robust growth in net sales and profit after tax, further supporting the stock's potential. However, concerns about long-term growth persist, as net sales have only grown at an annual rate of 4.55% over the past five years, and the stock is considered to have an expensive valuation relative to its peers.<BR><BR>In summary, while Engineers India Ltd. is currently facing a decline in its stock price, the overall performance metrics and investor interest suggest a complex picture where short-term fluctuations may not fully reflect the company's underlying strengths.

View full answer

Should I buy, sell or hold Engineers India Ltd.?

08-Aug-2026

When is the next results date for Engineers India Ltd.?

05-Aug-2026

The next results date for Engineers India Ltd. is 13 August 2026.

The next results date for Engineers India Ltd. is scheduled for 13 August 2026.

View full answer

How big is Engineers India?

11-Jun-2026

As of 10th June, Engineers India Ltd. has a market capitalization of 13,239.00 Cr, with recent net sales of 3,928.18 Cr and a net profit of 691.59 Cr.

As of 10th June, Engineers India Ltd. has a market capitalization of 13,239.00 Cr, categorizing it as a Small Cap company.<BR><BR>In the latest four quarters, Engineers India reported Net Sales of 3,928.18 Cr and a Net Profit of 691.59 Cr.<BR><BR>The latest annual period for the balance sheet is March 2025, with Shareholder's Funds amounting to 2,669.28 Cr and Total Assets valued at 4,939.64 Cr.

View full answer

Who are in the management team of Engineers India?

11-Jun-2026

The management team of Engineers India includes Vartika Shukla (Chairman/Executive Director), Ashok Kumar Kalra (Executive Director HR), Sanjay Jindal (Director Finance & CFO), and several other directors and independent members, bringing diverse expertise to the company.

The management team of Engineers India includes the following key members:<BR><BR>1. **Vartika Shukla** - Chairman / Executive Director<BR>2. **Ashok Kumar Kalra** - Executive Director (HR)<BR>3. **Sanjay Jindal** - Director (Finance) & CFO<BR>4. **Rajiv Agarwal** - Director (Technical)<BR>5. **Rajeev Gupta** - Director (Projects)<BR>6. **Atul Gupta** - Non-Executive Director<BR>7. **Rohit Mathur** - Non-Executive Director / Nomin<BR>8. **Suvendu Kumar Padhi** - Company Secretary<BR><BR>Additionally, there are several independent directors on the board, including:<BR><BR>- **Deepak Mhaskey**<BR>- **Harishkumar Madhusudan Joshi**<BR>- **Prashant Vasantrao Patil**<BR>- **Karuna Gopal Vartakavi**<BR>- **Ravi Shanker Prasad Singh**<BR>- **Jai Prakash Tomar**<BR><BR>This diverse team brings a wealth of experience and expertise to the company.

View full answer

Who are the peers of the Engineers India?

11-Jun-2026

Peers of Engineers India include Kalpataru Projects, Cemindia Project, IndiGrid Trust, KEC International, Ircon International, Afcons Infrastructure, Techno Electric Engineering, Rites, and Vertis Infra. Cemindia Project shows the highest growth and return, while Engineers India has below-average growth and a 1-year return of -0.41%.

Peers: The peers of Engineers India are Kalpataru Proj., Cemindia Project, IndiGrid Trust, KEC Internationa, Ircon Intl., Afcons Infrastr., Techno Elec.Engg, Rites, and Vertis Infra.<BR><BR>Quality Snapshot: Excellent management risk is observed at Kalpataru Proj., Cemindia Project, KEC Internationa, Techno Elec.Engg, and Rites, while Average management risk is found at IndiGrid Trust, Ircon Intl., and Afcons Infrastr. Growth is Excellent for Cemindia Project, Good for IndiGrid Trust and Techno Elec.Engg, and Average for Kalpataru Proj. and KEC Internationa, while Below Average growth is noted for Engineers India, Ircon Intl., Afcons Infrastr., and Rites. In terms of Capital Structure, Excellent is seen at Engineers India, Techno Elec.Engg, and Rites, Good at Cemindia Project and Ircon Intl., Average at Kalpataru Proj. and IndiGrid Trust, and Below Average at KEC Internationa, Afcons Infrastr., and Vertis Infra.<BR><BR>Return Snapshot: Cemindia Project has the highest 1-year return at 51.04%, while KEC Internationa has the lowest at -46.66%. Engineers India’s own 1-year return is -0.41%, which is better than KEC Internationa but worse than Cemindia Project. Additionally, the six-month return is negative for KEC Internationa, Ircon Intl., Afcons Infrastr., and Rites.

View full answer

What does Engineers India do?

10-Jun-2026

Engineers India Ltd. is a Government of India Enterprise specializing in consultancy, engineering, and turnkey projects in the construction industry. As of March 2026, it reported net sales of ₹926 Cr and a net profit of ₹196 Cr, with a market cap of ₹13,239 Cr.

Overview: <BR>Engineers India Ltd. is a Government of India Enterprise in the construction industry, specializing in consultancy and engineering projects as well as turnkey projects.<BR><BR>History: <BR>Engineers India Ltd. was incorporated as a Government of India Enterprise under the Ministry of Petroleum and Natural Gas. The latest quarterly results reported net sales and net profit for the period ending March 2026.<BR><BR>Financial Snapshot: <BR>Net Sales: 926 Cr (Quarterly Results - Mar 2026) <BR>Net Profit: 196 Cr (Quarterly Results - Mar 2026) <BR>Market Cap: INR 13,239 Cr (Small Cap)<BR><BR>Key Metrics: <BR>P/E: 19.00 <BR>Industry P/E: 35 <BR>Dividend Yield: 1.88% <BR>Debt Equity: -0.45 <BR>Return on Equity: 21.99% <BR>Price to Book: 4.27<BR><BR>Contact Details: <BR>Address: Engineers India Bhavan, 1 Bhikaji Cama Place RK Puram New Delhi New Delhi : 110066 <BR>Tel: 91-11-26762121 <BR>Email: eil.mktg@eil.co.in <BR>Website: http://www.engineersindia.com

View full answer

Are Engineers India Ltd. latest results good or bad?

22-May-2026

Engineers India Ltd.'s latest results are disappointing, with a 43.68% decline in net profit and a 23.46% drop in net sales compared to the previous quarter, leading to a negative market reaction. Despite a strong return on equity and a zero-debt balance sheet, concerns about project execution and profitability persist.

Engineers India Ltd.'s latest results indicate a challenging quarter. In Q4 FY26, the company reported a consolidated net profit of ₹195.53 crores, which represents a significant decline of 43.68% compared to the previous quarter and a 30.12% drop year-on-year. Net sales also fell sharply by 23.46% quarter-on-quarter to ₹926.29 crores, and by 8.31% year-on-year.<BR><BR>The operating margin saw a steep contraction, dropping to 16.39% from 29.10% in the previous quarter, indicating substantial margin pressure. This decline in both profit and sales has led to a negative market reaction, with the stock price falling nearly 9% on the results day and continuing to decline over the following week.<BR><BR>While the company maintains a strong return on equity of 19.87% and operates with a zero-debt balance sheet, the recent performance raises concerns about project execution and profitability. Overall, the results can be characterized as disappointing, reflecting execution challenges and margin compression.

View full answer

Has Engineers India Ltd. declared dividend?

27-Feb-2026

Yes, Engineers India Ltd. has declared a dividend of 30% (₹1 per share) with an ex-date of March 6, 2026. The company has shown strong total returns across various periods, including a 40.25% total return over the past year.

Engineers India Ltd. has declared a dividend.<BR><BR>Dividend Details:<BR>- Percentage announced: 30%<BR>- Amount per share: 1 per share<BR>- Ex-date: 06 Mar 26<BR><BR>Dividend Yield: 1.34%.<BR><BR>Total Returns by Period:<BR>Over the past 3 months, the company has achieved a price return of 10.94%, a dividend return of 1.27%, resulting in a total return of 12.21%.<BR><BR>In the last 6 months, the price return was 13.09%, with a dividend return of 1.24%, leading to a total return of 14.33%.<BR><BR>For the 1-year period, the price return stood at 37.21%, accompanied by a dividend return of 3.04%, culminating in a total return of 40.25%.<BR><BR>Over the past 2 years, the price return was 3.79%, with a dividend return of 3.46%, resulting in a total return of 7.25%.<BR><BR>In the 3-year period, the price return reached 211.67%, with a dividend return of 13.73%, achieving a total return of 225.4%.<BR><BR>Finally, for the 4-year period, the price return was 267.19%, while the dividend return was 21.93%, leading to a total return of 289.12%.<BR><BR>In the 5-year span, the price return was 176.65%, with a dividend return of 21.71%, resulting in a total return of 198.36%.<BR><BR>Overall, Engineers India Ltd. has demonstrated a consistent ability to provide dividends and strong total returns across various periods, indicating a positive financial performance and shareholder value enhancement.

View full answer

Is Engineers India technically bullish or bearish?

05-Dec-2025

As of December 4, 2025, the trend is mildly bullish due to positive daily moving averages and strong OBV, but caution is advised due to bearish signals from the weekly and monthly MACD.

As of 4 December 2025, the technical trend has changed from sideways to mildly bullish. The current stance is mildly bullish, driven primarily by the daily moving averages indicating bullish momentum and a strong On-Balance Volume (OBV) showing bullish strength on both weekly and monthly time frames. However, the weekly MACD remains bearish, and the monthly MACD is mildly bearish, which suggests caution. The KST is mildly bullish on the weekly but mildly bearish on the monthly, indicating mixed signals across time frames. Overall, while there are bullish indicators, the presence of bearish signals in the MACD and Bollinger Bands suggests a need for careful monitoring.

View full answer

How has been the historical performance of Engineers India?

17-Nov-2025

Engineers India saw net sales peak at 3,330.14 Cr in Mar'23, declining to 3,087.59 Cr by Mar'25, while operating profit increased from 472.72 Cr to 672.52 Cr, and consolidated net profit rose from 346.27 Cr to 579.77 Cr during the same period. Total assets grew from 4,051.05 Cr to 4,939.64 Cr, with improved cash flow from -112.00 Cr to 221.00 Cr in Mar'24.

Answer:<BR>The historical performance of Engineers India shows a fluctuating trend in net sales, with a peak of 3,330.14 Cr in Mar'23, followed by a decline to 3,087.59 Cr in Mar'25. Total operating income mirrored this trend, reaching 3,330.14 Cr in Mar'23 and decreasing to 3,087.59 Cr in Mar'25. The total expenditure, excluding depreciation, also saw a decline from 3,021.84 Cr in Mar'23 to 2,575.33 Cr in Mar'25, contributing to an increase in operating profit (PBDIT) from 472.72 Cr in Mar'23 to 672.52 Cr in Mar'25. Profit before tax rose significantly from 445.51 Cr in Mar'23 to 630.29 Cr in Mar'25, leading to a profit after tax of 471.90 Cr in Mar'25, up from 344.23 Cr in Mar'23. The consolidated net profit also increased from 346.27 Cr in Mar'23 to 579.77 Cr in Mar'25, reflecting a positive trend in profitability. The company's total assets grew from 4,051.05 Cr in Mar'23 to 4,939.64 Cr in Mar'25, while total liabilities increased from 4,051.05 Cr to 4,939.64 Cr in the same period. Cash flow from operating activities showed a recovery, moving from -112.00 Cr in Mar'23 to 221.00 Cr in Mar'24, with a net cash inflow of 187.00 Cr in Mar'24.<BR><BR>Breakdown:<BR>Engineers India experienced a peak in net sales at 3,330.14 Cr in Mar'23, followed by a decline to 3,087.59 Cr in Mar'25. Total operating income followed a similar pattern, decreasing from 3,330.14 Cr to 3,087.59 Cr over the same period. Total expenditure, excluding depreciation, decreased from 3,021.84 Cr in Mar'23 to 2,575.33 Cr in Mar'25, which contributed to an increase in operating profit (PBDIT) from 472.72 Cr to 672.52 Cr. Profit before tax rose from 445.51 Cr in Mar'23 to 630.29 Cr in Mar'25, resulting in a profit after tax of 471.90 Cr, up from 344.23 Cr. The consolidated net profit also increased significantly from 346.27 Cr to 579.77 Cr. The company's total assets grew from 4,051.05 Cr to 4,939.64 Cr, while total liabilities increased correspondingly. Cash flow from operating activities improved from -112.00 Cr in Mar'23 to 221.00 Cr in Mar'24, culminating in a net cash inflow of 187.00 Cr in Mar'24.

View full answer

Is Engineers India overvalued or undervalued?

29-Jul-2025

As of July 28, 2025, Engineers India is considered overvalued with a PE ratio of 20.97 and an EV to EBITDA of 21.30, indicating it is priced at a premium compared to peers like Ircon International, despite a strong year-to-date stock return of 18.55%.

As of 28 July 2025, Engineers India has moved from a valuation grade of very expensive to expensive. The company is currently considered overvalued. Key ratios include a PE ratio of 20.97, an EV to EBITDA of 21.30, and a PEG ratio of 0.69, which suggests that while the company has growth potential, its current price may not be justified by its earnings growth.<BR><BR>In comparison to peers, Engineers India’s valuation metrics are notably higher than those of Ircon International, which has a PE of 22.77 and an EV to EBITDA of 18.55, indicating that Engineers India is priced at a premium relative to this competitor. Additionally, Rail Vikas is significantly more expensive with a PE ratio of 57.69. Despite a year-to-date stock return of 18.55%, which outperformed the Sensex's 3.52%, the overall valuation suggests that the stock may not provide sufficient upside given its current price levels.

View full answer

Who are the top shareholders of the Engineers India?

06-Jun-2025

The top shareholder of Engineers India is the President of India, holding 51.32%. Other significant shareholders include mutual funds (7.8%), foreign institutional investors (6.75%), and individual investors (26.68%).

The top shareholders of Engineers India include the President of India, who holds the largest stake at 51.32%. Other significant shareholders are mutual funds, which collectively hold 7.8% through 21 different schemes, and foreign institutional investors (FIIs), who account for 6.75% with 117 FIIs involved. The highest public shareholder is HSBC Small Cap Fund, holding 3.02%. Additionally, individual investors collectively own 26.68% of the company.

View full answer

What is the bonus history of the Engineers India?

06-Jun-2025

Engineers India has a history of issuing bonuses, with the most recent being a 1:1 bonus on December 30, 2016, and a prior 2:1 bonus on May 6, 2010. This demonstrates the company's commitment to rewarding its shareholders.

Engineers India has a notable bonus history. The most recent bonus issue was a 1:1 bonus announced with an ex-date of December 30, 2016, and the record date was January 2, 2017. Prior to that, the company issued a 2:1 bonus on May 6, 2010, with a record date of May 7, 2010. This reflects the company's practice of rewarding its shareholders through bonus shares.

View full answer
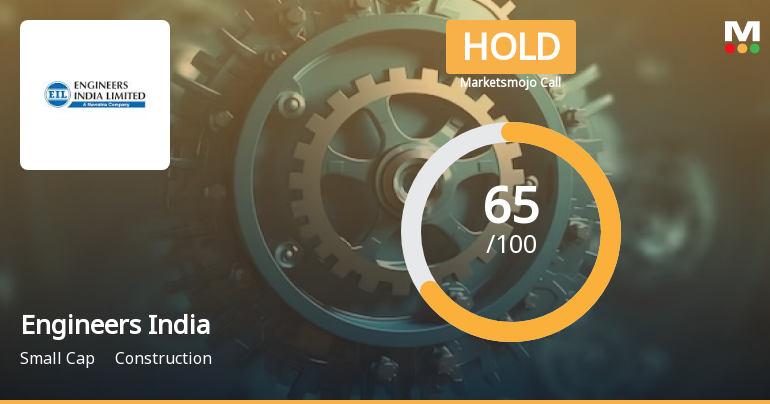
iScoreScore
Click here to find our call on this stock
Strong Sell
Sell
Hold
Buy
Strong Buy

Dashboard

1

High Management Efficiency with a high ROE of 17.80%

 
2

The company is Net-Debt Free

 
3

Positive results in Mar 26

4

High Institutional Holdings at 23.43%

5

Market Beating Performance

stock-summaryMojo Parameters

Mojo Parameters

Loading Valuation Snapshot...

Stock DNA

stock-summary
Industry

Construction

stock-summary
Market cap

INR 13,500 Cr (Small Cap)

stock-summary
P/E

20.00

stock-summary
Industry P/E

36

stock-summary
Dividend Yield

1.87%

stock-summary
Debt Equity

-0.45

stock-summary
Return on Equity

21.99%

stock-summary
Price to Book

4.30

Revenue and Profits:
Net Sales:
926 Cr
(Quarterly Results - Mar 2026)
Net Profit:
196 Cr
stock-summaryTotal Returns
Total Returns (Price + Dividend) stock-summary
Dividend Yield (1.87%)
TimePeriod
Price Return
Dividend Return
Total Return
3 Months
-7.91%
0%
-7.91%
6 Months
40.39%
0.82%
41.21%
1 Year
18.44%
2.36%
20.8%
2 Years
3.15%
3.40%
6.55%
3 Years
60.63%
6.00%
66.63%
4 Years
249.38%
19.88%
269.26%
5 Years
225.29%
22.05%
247.34%

Latest dividend: 1.5 per share ex-dividend date: Mar-06-2026

Risk Adjusted Returns v/s stock-summary
Returns Beta
Icon
Beta has not been calculated since enough price history is not available
stock-summaryNews & Corporate Actions

Announcements stock-summary

Announcement under Regulation 30 (LODR)-Analyst / Investor Meet - Intimation

07-Aug-2026 | Source : BSE

Intimation of Schedule of Earning Call Post Results for the first quarter ended on 30.06.2026 for the Financial Year 2026-27 pursuant to Regulation 30 of the SEBI Listing Regulations

Board Meeting Intimation for Notice Of Board Meeting To Inter-Alia Consider And Approve Un-Audited Financial Results For The Quarter Ended 30.06.2026

04-Aug-2026 | Source : BSE

Engineers India Ltdhas informed BSE that the meeting of the Board of Directors of the Company is scheduled on 13/08/2026 inter alia to consider and approve Notice of Board Meeting to inter-alia Consider and approve Un-audited Financial Results for the quarter ended 30.06.2026

Compliances-Certificate under Reg. 74 (5) of SEBI (DP) Regulations 2018

09-Jul-2026 | Source : BSE

Certificate under Reg 74(5) of SEBI(DP) Regulations2018 for the quarter ended 30.06.2026.

Corporate Actions stock-summary

stock-summary
BOARD MEETING

13 Aug 2026

stock-summary
DIVIDEND

Engineers India Ltd. has declared 30% dividend, ex-date: 06 Mar 26

stock-summary
SPLITS

Engineers India Ltd. has announced 5:10 stock split, ex-date: 06 May 10

stock-summary
BONUS

Engineers India Ltd. has announced 1:1 bonus issue, ex-date: 30 Dec 16

stock-summary
RIGHTS

No Rights history available

stock-summaryKey Factors

Quality key factors stock-summary

Factor
Value
Sales Growth (5y)
4.55%
EBIT Growth (5y)
14.93%
EBIT to Interest (avg)
100.00
Debt to EBITDA (avg)
Net Debt is too low
Net Debt to Equity (avg)
-0.45
Sales to Capital Employed (avg)
1.48
Tax Ratio
21.88%
Dividend Payout Ratio
38.78%
Pledged Shares
0
Institutional Holding
23.43%
ROCE (avg)
52.43%
ROE (avg)
17.80%

Valuation key factors

Factor
Value
P/E Ratio
20
Industry P/E
36
Price to Book Value
4.30
EV to EBIT
18.49
EV to EBITDA
17.38
EV to Capital Employed
7.05
EV to Sales
3.08
PEG Ratio
1.01
Dividend Yield
1.87%
ROCE (Latest)
38.14%
ROE (Latest)
21.98%

Technicals key factors

Indicator
Weekly
Monthly
MACD
Mildly Bearish
Bullish
RSI
No Signal
No Signal
Bollinger Bands
Bullish
Bullish
Moving Averages
Bullish (Daily)
KST
Mildly Bearish
Bullish
Dow Theory
Mildly Bearish
No Trend
OBV
Bullish
Bullish
stock-summary Technical Indicator Scale: Bearish, Mildly Bearish, Sideways, Mildly Bullish, Bullish  Turned 
stock-summaryShareholding
Shareholding Snapshot : Jun 2026stock-summary
Shareholding Compare (%holding) stock-summary
Majority shareholders

Promoters

Pledged Promoter Holdings

None

Mutual Funds

Held by 26 Schemes (12.55%)

FIIs

Held by 156 FIIs (9.17%)

Promoter with highest holding

President Of India (51.32%)

Highest Public shareholder

Kotak Mahindra Trustee Co Ltd A/c Kotak Multicap Fund (3.75%)

Individual Investors Holdings

20.86%

stock-summaryFinancial
[
  {
    "link": "quarterly",
    "btn_text": "All Quarterly Results",
    "header": "Quarterly Results Snapshot (Consolidated) - Mar'26 - QoQ",
    "rhs": [
      {
        "prefix": "Net Sales ",
        "suffix": "QoQ Growth in quarter ended Mar 2026 is -23.46% vs 31.36% in Dec 2025",
        "dir": -1
      },
      {
        "prefix": "Consolidated Net Profit ",
        "suffix": "QoQ Growth in quarter ended Mar 2026 is -43.68% vs 315.82% in Dec 2025",
        "dir": -1
      }
    ],
    "table": {
      "header": [
        "Mar'26",
        "Dec'25",
        "Change(%)"
      ],
      "body": [
        {
          "field": "Net Sales",
          "val1": "926.29",
          "val2": "1,210.24",
          "chgp": "-23.46%",
          "chgp_class": "negative"
        },
        {
          "field": "Operating Profit (PBDIT) excl Other Income",
          "val1": "151.82",
          "val2": "352.23",
          "chgp": "-56.90%",
          "chgp_class": "negative"
        },
        {
          "field": "Interest",
          "val1": "0.35",
          "val2": "0.60",
          "chgp": "-41.67%",
          "chgp_class": "positive"
        },
        {
          "field": "Exceptional Items",
          "val1": "0.00",
          "val2": "0.00",
          "chgp": "",
          "chgp_class": "neutral"
        },
        {
          "field": "Consolidate Net Profit",
          "val1": "195.53",
          "val2": "347.17",
          "chgp": "-43.68%",
          "chgp_class": "negative"
        },
        {
          "field": "Operating Profit Margin (Excl OI)",
          "val1": "16.39%",
          "val2": "29.10%",
          "chgp": "-12.71%",
          "chgp_class": "negative"
        }
      ]
    }
  },
  {
    "link": "half-yearly",
    "btn_text": "All Half Yearly Results",
    "header": "Half Yearly Results Snapshot (Consolidated) - Sep'25",
    "rhs": [
      {
        "prefix": "Net Sales ",
        "suffix": " Growth in half year ended Sep 2025 is 36.48% vs -18.36% in Sep 2024",
        "dir": 1
      },
      {
        "prefix": "Consolidated Net Profit ",
        "suffix": " Growth in half year ended Sep 2025 is -22.14% vs -28.21% in Sep 2024",
        "dir": 1
      }
    ],
    "table": {
      "header": [
        "Sep'25",
        "Sep'24",
        "Change(%)"
      ],
      "body": [
        {
          "field": "Net Sales",
          "val1": "1,791.65",
          "val2": "1,312.77",
          "chgp": "36.48%",
          "chgp_class": "positive"
        },
        {
          "field": "Operating Profit (PBDIT) excl Other Income",
          "val1": "191.83",
          "val2": "113.40",
          "chgp": "69.16%",
          "chgp_class": "positive"
        },
        {
          "field": "Interest",
          "val1": "1.17",
          "val2": "1.51",
          "chgp": "-22.52%",
          "chgp_class": "positive"
        },
        {
          "field": "Exceptional Items",
          "val1": "0.00",
          "val2": "0.00",
          "chgp": "",
          "chgp_class": "neutral"
        },
        {
          "field": "Consolidate Net Profit",
          "val1": "148.89",
          "val2": "191.23",
          "chgp": "-22.14%",
          "chgp_class": "negative"
        },
        {
          "field": "Operating Profit Margin (Excl OI)",
          "val1": "10.71%",
          "val2": "8.64%",
          "chgp": "2.07%",
          "chgp_class": "positive"
        }
      ]
    }
  },
  {
    "link": "nine-monthly",
    "btn_text": "All Nine Monthly Results",
    "header": "Nine Monthly Results Snapshot (Consolidated) - Dec'25",
    "rhs": [
      {
        "prefix": "Net Sales ",
        "suffix": "YoY Growth in nine months ended Dec 2025 is 44.51% vs -16.09% in Dec 2024",
        "dir": 1
      },
      {
        "prefix": "Consolidated Net Profit ",
        "suffix": "YoY Growth in nine months ended Dec 2025 is 65.38% vs -9.03% in Dec 2024",
        "dir": 1
      }
    ],
    "table": {
      "header": [
        "Dec'25",
        "Dec'24",
        "Change(%)"
      ],
      "body": [
        {
          "field": "Net Sales",
          "val1": "3,001.89",
          "val2": "2,077.36",
          "chgp": "44.51%",
          "chgp_class": "positive"
        },
        {
          "field": "Operating Profit (PBDIT) excl Other Income",
          "val1": "544.06",
          "val2": "211.30",
          "chgp": "157.48%",
          "chgp_class": "positive"
        },
        {
          "field": "Interest",
          "val1": "1.77",
          "val2": "2.15",
          "chgp": "-17.67%",
          "chgp_class": "positive"
        },
        {
          "field": "Exceptional Items",
          "val1": "0.00",
          "val2": "0.00",
          "chgp": "",
          "chgp_class": "neutral"
        },
        {
          "field": "Consolidate Net Profit",
          "val1": "496.06",
          "val2": "299.96",
          "chgp": "65.38%",
          "chgp_class": "positive"
        },
        {
          "field": "Operating Profit Margin (Excl OI)",
          "val1": "18.12%",
          "val2": "10.17%",
          "chgp": "7.95%",
          "chgp_class": "positive"
        }
      ]
    }
  },
  {
    "link": "annual",
    "btn_text": "All Annual Results",
    "header": "Annual Results Snapshot (Consolidated) - Mar'26",
    "rhs": [
      {
        "prefix": "Net Sales ",
        "suffix": "YoY Growth in year ended Mar 2026 is 27.22% vs -5.89% in Mar 2025",
        "dir": 1
      },
      {
        "prefix": "Consolidated Net Profit ",
        "suffix": "YoY Growth in year ended Mar 2026 is 19.29% vs 30.21% in Mar 2025",
        "dir": -1
      }
    ],
    "table": {
      "header": [
        "Mar'26",
        "Mar'25",
        "Change(%)"
      ],
      "body": [
        {
          "field": "Net Sales",
          "val1": "3,928.18",
          "val2": "3,087.59",
          "chgp": "27.22%",
          "chgp_class": "positive"
        },
        {
          "field": "Operating Profit (PBDIT) excl Other Income",
          "val1": "695.88",
          "val2": "512.26",
          "chgp": "35.85%",
          "chgp_class": "positive"
        },
        {
          "field": "Interest",
          "val1": "2.12",
          "val2": "2.66",
          "chgp": "-20.30%",
          "chgp_class": "positive"
        },
        {
          "field": "Exceptional Items",
          "val1": "0.00",
          "val2": "0.00",
          "chgp": "",
          "chgp_class": "neutral"
        },
        {
          "field": "Consolidate Net Profit",
          "val1": "691.59",
          "val2": "579.77",
          "chgp": "19.29%",
          "chgp_class": "positive"
        },
        {
          "field": "Operating Profit Margin (Excl OI)",
          "val1": "17.72%",
          "val2": "16.59%",
          "chgp": "1.13%",
          "chgp_class": "positive"
        }
      ]
    }
  }
]

Quarterly Results Snapshot (Consolidated) - Mar'26 - QoQstock-summary

Mar'26
Dec'25
Change(%)
Net Sales
926.29
1,210.24
-23.46%
Operating Profit (PBDIT) excl Other Income
151.82
352.23
-56.90%
Interest
0.35
0.60
-41.67%
Exceptional Items
0.00
0.00
Consolidate Net Profit
195.53
347.17
-43.68%
Operating Profit Margin (Excl OI)
16.39%
29.10%
-12.71%
Values in Rs Cr.
Direction Arrows
Net Sales

QoQ Growth in quarter ended Mar 2026 is -23.46% vs 31.36% in Dec 2025

Direction Arrows
Consolidated Net Profit

QoQ Growth in quarter ended Mar 2026 is -43.68% vs 315.82% in Dec 2025

Half Yearly Results Snapshot (Consolidated) - Sep'25stock-summary

Sep'25
Sep'24
Change(%)
Net Sales
1,791.65
1,312.77
36.48%
Operating Profit (PBDIT) excl Other Income
191.83
113.40
69.16%
Interest
1.17
1.51
-22.52%
Exceptional Items
0.00
0.00
Consolidate Net Profit
148.89
191.23
-22.14%
Operating Profit Margin (Excl OI)
10.71%
8.64%
2.07%
Values in Rs Cr.
Direction Arrows
Net Sales

Growth in half year ended Sep 2025 is 36.48% vs -18.36% in Sep 2024

Direction Arrows
Consolidated Net Profit

Growth in half year ended Sep 2025 is -22.14% vs -28.21% in Sep 2024

Nine Monthly Results Snapshot (Consolidated) - Dec'25stock-summary

Dec'25
Dec'24
Change(%)
Net Sales
3,001.89
2,077.36
44.51%
Operating Profit (PBDIT) excl Other Income
544.06
211.30
157.48%
Interest
1.77
2.15
-17.67%
Exceptional Items
0.00
0.00
Consolidate Net Profit
496.06
299.96
65.38%
Operating Profit Margin (Excl OI)
18.12%
10.17%
7.95%
Values in Rs Cr.
Direction Arrows
Net Sales

YoY Growth in nine months ended Dec 2025 is 44.51% vs -16.09% in Dec 2024

Direction Arrows
Consolidated Net Profit

YoY Growth in nine months ended Dec 2025 is 65.38% vs -9.03% in Dec 2024

Annual Results Snapshot (Consolidated) - Mar'26stock-summary

Mar'26
Mar'25
Change(%)
Net Sales
3,928.18
3,087.59
27.22%
Operating Profit (PBDIT) excl Other Income
695.88
512.26
35.85%
Interest
2.12
2.66
-20.30%
Exceptional Items
0.00
0.00
Consolidate Net Profit
691.59
579.77
19.29%
Operating Profit Margin (Excl OI)
17.72%
16.59%
1.13%
Values in Rs Cr.
Direction Arrows
Net Sales

YoY Growth in year ended Mar 2026 is 27.22% vs -5.89% in Mar 2025

Direction Arrows
Consolidated Net Profit

YoY Growth in year ended Mar 2026 is 19.29% vs 30.21% in Mar 2025

stock-summaryCompany CV
About Engineers India Ltd. stock-summary
stock-summary
Engineers India Ltd.
Small Cap
Construction
Engineers India Limited (EIL) is a Government of India Enterprise under Ministry of Petroleum and Natural Gas. The Company operates into two major segments, Consultancy & Engineering Projects and Turnkey Projects. The Company is principally engaged in providing design, engineering, procurement, construction, and integrated project management services primarily for oil, gas, fertilizers, steel, railways, power, infrastructure and petrochemical industries.
Company Coordinates stock-summary
Company Details
Engineers India Bhavan, 1 Bhikaji Cama Place RK Puram New Delhi New Delhi : 110066
stock-summary
Tel: 91-11-26762121
stock-summary
eil.mktg@eil.co.in
Registrar Details
Karvy Computershare Pvt Ltd, Plot No 17-24 , Near Image Hospital,, Reliance Cybervilae,Vithalrao Nagar,, Madhapur, Hyderabad