
Compare Engineers India with Similar Stocks
Dashboard
High Management Efficiency with a high ROE of 17.00%
Company has a low Debt to Equity ratio (avg) at 0 times
Poor long term growth as Net Sales has grown by an annual rate of 6.88% over the last 5 years
With a growth in Net Profit of 180.17%, the company declared Very Positive results in Dec 25
With ROE of 19.9, it has a Fair valuation with a 4.2 Price to Book Value
High Institutional Holdings at 21.16%
Market Beating performance in long term as well as near term
Stock DNA
Construction
INR 12,744 Cr (Small Cap)
15.00
10
2.48%
-0.50
19.87%
4.19
Total Returns (Price + Dividend) 
Latest dividend: 1 per share ex-dividend date: Dec-04-2025
Risk Adjusted Returns v/s
Returns Beta

News
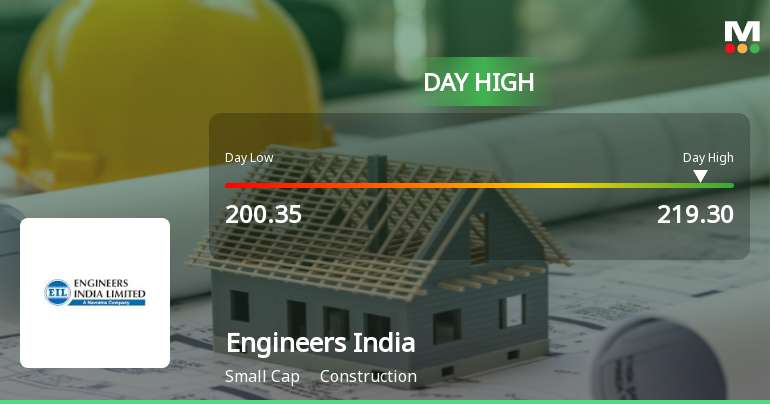
Engineers India Ltd. Hits Intraday High with 7.75% Surge on 16 Feb 2026
Engineers India Ltd. demonstrated robust intraday strength on 16 Feb 2026, surging to an intraday high of Rs 214.85, marking a 7.75% increase on the day and outperforming its sector by 5.77% amid a broadly positive market backdrop.
Read full news article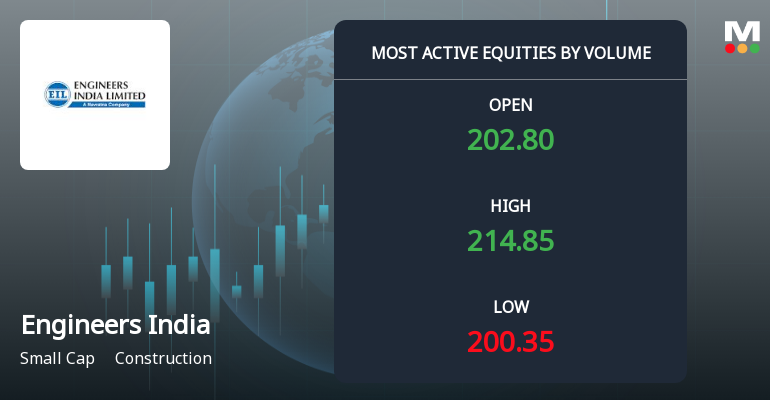
Engineers India Ltd. Sees Exceptional Volume Surge Amid Strong Price Gains
Engineers India Ltd. (ENGINERSIN) has emerged as one of the most actively traded stocks by volume on 16 Feb 2026, registering a remarkable surge in investor participation and delivering strong returns amid a broadly mixed market environment.
Read full news article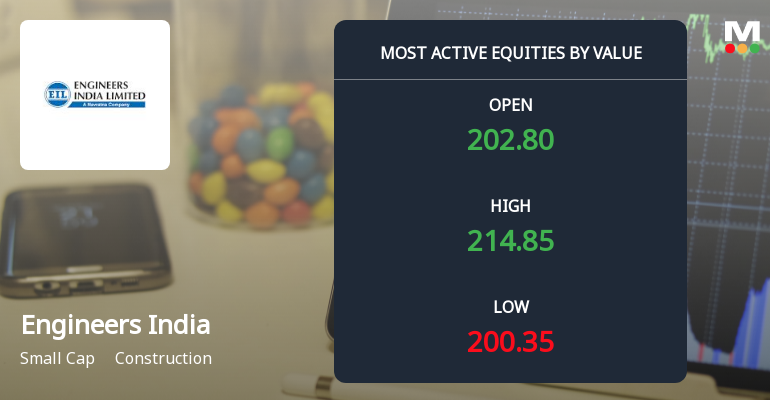
Engineers India Ltd. Sees Robust Trading Activity Amid Sector Outperformance
Engineers India Ltd. (ENGINERSIN) has emerged as one of the most actively traded stocks by value on 16 Feb 2026, reflecting heightened investor interest and strong institutional participation. The construction sector heavyweight outperformed its peers and broader market indices, buoyed by significant volume and value turnover, alongside a notable upgrade in its Mojo Grade from Sell to Hold.
Read full news article Announcements
Announcement under Regulation 30 (LODR)-Analyst / Investor Meet - Outcome
14-Feb-2026 | Source : BSEUpdate on meeting with Analyst/Institutional Investors-Audio Recording
Announcement under Regulation 30 (LODR)-Analyst / Investor Meet - Outcome
14-Feb-2026 | Source : BSEUpdate on meeting with Analyst/Institutional Investors-Audio Recording
Announcement under Regulation 30 (LODR)-Newspaper Publication
14-Feb-2026 | Source : BSENewspaper Advertisement-Un-Audited Financial Results for the quarter and nine months ended on 31.12.2025
Corporate Actions

No Upcoming Board Meetings

Engineers India Ltd. has declared 20% dividend, ex-date: 04 Dec 25

Engineers India Ltd. has announced 5:10 stock split, ex-date: 06 May 10

Engineers India Ltd. has announced 1:1 bonus issue, ex-date: 30 Dec 16

No Rights history available
Quality key factors
Valuation key factors
Technicals key factors
 Technical Indicator Scale: Bearish, Mildly Bearish, Sideways, Mildly Bullish, Bullish Turned
 Shareholding Snapshot : Dec 2025
Shareholding Compare (%holding)
Promoters
None
Held by 23 Schemes (11.41%)
Held by 147 FIIs (7.74%)
President Of India (51.32%)
Kotak Mahindra Trustee Co Ltd A/c Kotak Multicap Fund (3.75%)
23.13%
Quarterly Results Snapshot (Consolidated) - Dec'25 - QoQ

QoQ Growth in quarter ended Dec 2025 is 31.36% vs 5.85% in Sep 2025
QoQ Growth in quarter ended Dec 2025 is 315.82% vs 27.66% in Sep 2025
Half Yearly Results Snapshot (Consolidated) - Sep'25
Growth in half year ended Sep 2025 is 36.48% vs -18.36% in Sep 2024
Growth in half year ended Sep 2025 is -22.14% vs -28.21% in Sep 2024
Nine Monthly Results Snapshot (Consolidated) - Dec'25
YoY Growth in nine months ended Dec 2025 is 44.51% vs -16.09% in Dec 2024
YoY Growth in nine months ended Dec 2025 is 65.38% vs -9.03% in Dec 2024
Annual Results Snapshot (Consolidated) - Mar'25

YoY Growth in year ended Mar 2025 is -5.89% vs -1.48% in Mar 2024
YoY Growth in year ended Mar 2025 is 30.21% vs 28.59% in Mar 2024
About Engineers India Ltd.

Company Coordinates


