
Compare Enplas Corp. with Similar Stocks
Dashboard
1
Company has very low debt and has enough cash to service the debt requirements
2
The company has declared positive results in Mar'2025 after 2 consecutive negative quarters
3
With ROE of 7.62%, it has a attractive valuation with a 0.65 Price to Book Value
4
Market Beating performance in long term as well as near term
Stock DNA
Industrial Manufacturing
JPY 50,806 Million (Small Cap)
8.00
NA
0.01%
-0.42
5.50%
0.92
Revenue and Profits:
Net Sales:
9,264 Million
(Quarterly Results - Mar 2025)
Net Profit:
1,110 Million
Total Returns (Price + Dividend) 
TimePeriod
Price Return
Dividend Return
Total Return
3 Months
83.97%
0%
83.97%
6 Months
74.46%
0%
74.46%
1 Year
14.45%
0%
14.45%
2 Years
66.67%
0%
66.67%
3 Years
157.18%
0%
157.18%
4 Years
118.29%
0%
118.29%
5 Years
243.57%
0%
243.57%
Enplas Corp. for the last several years.
Risk Adjusted Returns v/s
News
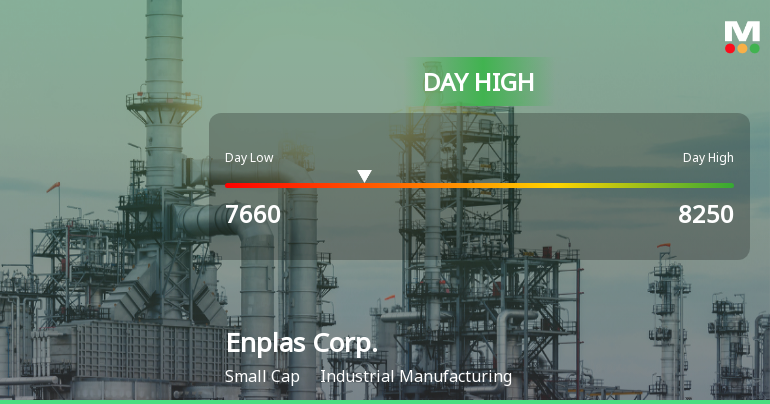
Enplas Corp. Hits Day High with 16.54% Surge in Stock Price
Enplas Corp., a small-cap industrial manufacturer, has seen notable stock performance, gaining significantly today and achieving an intraday high. Over the past week and month, the company has demonstrated strong growth, significantly outperforming the Japan Nikkei 225, despite facing challenges such as declining pre-tax profit and rising costs.
Read full news article Announcements

No announcement available
Corporate Actions
No corporate action available
Quality key factors
Factor
Value
Sales Growth (5y)
3.89%
EBIT Growth (5y)
19.57%
EBIT to Interest (avg)
100.00
Debt to EBITDA (avg)
0
Net Debt to Equity (avg)
-0.43
Sales to Capital Employed (avg)
0.75
Tax Ratio
22.70%
Dividend Payout Ratio
15.68%
Pledged Shares
0
Institutional Holding
0
ROCE (avg)
17.86%
ROE (avg)
7.59%
Valuation key factors
Factor
Value
P/E Ratio
8
Industry P/E
Price to Book Value
0.65
EV to EBIT
2.31
EV to EBITDA
1.59
EV to Capital Employed
0.38
EV to Sales
0.32
PEG Ratio
0.56
Dividend Yield
0.01%
ROCE (Latest)
16.65%
ROE (Latest)
7.62%
Technicals key factors
Indicator
Weekly
Monthly
MACD
Mildly Bearish
Bullish
RSI
No Signal
Bearish
Bollinger Bands
Bullish
Mildly Bullish
Moving Averages
Mildly Bullish (Daily)
KST
Bullish
Bullish
Dow Theory
No Trend
No Trend
OBV
No Trend
No Trend
 Technical Indicator Scale: Bearish, Mildly Bearish, Sideways, Mildly Bullish, Bullish Turned
 Shareholding Snapshot
No data for shareholding present.
Shareholding Compare (%holding)
No data for shareholding present.
Quarterly Results Snapshot (Consolidated) - Mar'25 - QoQ
Mar'25
Dec'24
Change(%)
Net Sales
9,264.00
9,105.00
1.75%
Operating Profit (PBDIT) excl Other Income
1,828.00
1,314.00
39.12%
Interest
18.00
20.00
-10.00%
Exceptional Items
-33.00
-1.00
-3,200.00%
Consolidate Net Profit
1,110.00
815.00
36.20%
Operating Profit Margin (Excl OI)
130.00%
80.10%
4.99%
USD in Million.

Net Sales
QoQ Growth in quarter ended Mar 2025 is 1.75% vs 0.07% in Dec 2024
Consolidated Net Profit
QoQ Growth in quarter ended Mar 2025 is 36.20% vs 34.93% in Dec 2024
Annual Results Snapshot (Consolidated) - Mar'25
Mar'25
Mar'24
Change(%)
Net Sales
38,069.00
37,805.00
0.70%
Operating Profit (PBDIT) excl Other Income
7,705.00
7,031.00
9.59%
Interest
77.00
76.00
1.32%
Exceptional Items
-221.00
-283.00
21.91%
Consolidate Net Profit
4,059.00
3,519.00
15.35%
Operating Profit Margin (Excl OI)
138.90%
122.90%
1.60%
USD in Million.
Net Sales
YoY Growth in year ended Mar 2025 is 0.70% vs -10.50% in Mar 2024
Consolidated Net Profit
YoY Growth in year ended Mar 2025 is 15.35% vs -27.35% in Mar 2024
About Enplas Corp.

Enplas Corp.
Industrial Manufacturing
No Details Available.
Company Coordinates
No Company Details Available
InfinHub Market Technologies FZ-LLC, Building-2, Unit 112, Dubai Internet City, Dubai, United Arab Emirates
GET THE MARKETSMOJO APP


Company
Stocks
Portfolio


"Investment in securities markets are subject to market risk. Read all the related documents carefully before investing."