
Compare Enterprise Intl. with Similar Stocks
Dashboard
With a Operating Losses, the company has a Weak Long Term Fundamental Strength
- Company's ability to service its debt is weak with a poor EBIT to Interest (avg) ratio of -0.64
- The company has reported losses. Due to this company has reported negative ROCE
Flat results in Mar 26
Risky - Negative EBITDA
Below par performance in long term as well as near term
Stock DNA
Trading & Distributors
INR 7 Cr (Micro Cap)
NA (Loss Making)
26
0.00%
-0.35
-0.16%
0.51
Total Returns (Price + Dividend) 
Enterprise Intl. for the last several years.
Risk Adjusted Returns v/s
Returns Beta

News
Are Enterprise International Ltd latest results good or bad?
Enterprise International Ltd's latest financial results for Q3 FY26 highlight significant operational challenges. The company reported a net loss of ₹0.10 crores, contrasting sharply with a profit of ₹0.09 crores in the previous quarter. This marks a continuation of the trend of operating losses, as the company has faced negative operating profits excluding other income for five consecutive quarters, with the latest operating margin at -16.29%, a notable decline from -2.01% in the same quarter last year. Revenue for the quarter stood at ₹1.78 crores, reflecting a dramatic recovery from ₹0.01 crores in the previous quarter but still trailing the ₹1.99 crores reported in December 2024 by 10.55%. This extreme volatility raises concerns about the stability of the company's revenue streams and overall business model. The financial performance indicates a broader structural decline, with a cumulative revenue co...
Read full news article
Enterprise International Q4 FY26: Zero Revenue Quarter Signals Deepening Operational Crisis
Enterprise International Ltd., a micro-cap trading and distribution company with a market capitalisation of ₹7.00 crores, reported catastrophic results for Q4 FY26 (Mar'26 quarter), recording zero net sales for the quarter—a complete operational shutdown that marks the company's worst quarterly performance in recent history. Despite this revenue collapse, the company managed a modest net profit of ₹0.04 crores, sustained entirely by other income of ₹0.17 crores, highlighting the complete absence of core business activity.
Read full news article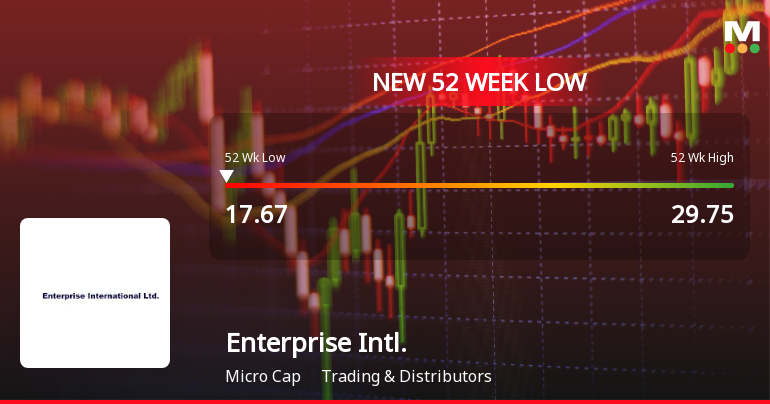
Enterprise International Ltd Falls to 52-Week Low of Rs 17.67 as Sell-Off Deepens
For the second consecutive session, Enterprise International Ltd has succumbed to selling pressure, sliding to a fresh 52-week low of Rs 17.67 on 18 May 2026. This decline extends the stock’s year-long underperformance, with returns down 26.83% compared to the Sensex’s 8.58% fall over the same period.
Read full news article Announcements
Compliances-Certificate under Reg. 74 (5) of SEBI (DP) Regulations 2018
13-Jul-2026 | Source : BSEConfirmation of Dematerialisation under Reg. 74(5) of SEBI (DP) Regulations 2018 for the quarter ended 30th June2026
Compliances-Non-Applicability Of Statement Of Deviation And Variation
13-Jul-2026 | Source : BSENon-applicability of statement of deviation and variation under Reg 32 of SEBI (LODR) Regulation 2015
Board Meeting Intimation for To Approve And Take On Record Un-Audited Financial Results For The Quarter Ended 30Th June2026
13-Jul-2026 | Source : BSEEnterprise International Ltdhas informed BSE that the meeting of the Board of Directors of the Company is scheduled on 06/08/2026 inter alia to consider and approve un-audited financial results for the quarter ended 30th June 2026
Corporate Actions

06 Aug 2026

No Dividend history available

No Splits history available

No Bonus history available

No Rights history available
Quality key factors
Valuation key factors
Technicals key factors
 Technical Indicator Scale: Bearish, Mildly Bearish, Sideways, Mildly Bullish, Bullish Turned
 Shareholding Snapshot : Jun 2026
Shareholding Compare (%holding)
Non Institution
None
Held by 0 Schemes
Held by 0 FIIs
Brijlata Sarda (20.28%)
Chemsilk Commerce Pvt Ltd (0%)
45.4%
Quarterly Results Snapshot (Standalone) - Mar'26 - QoQ

QoQ Growth in quarter ended Mar 2026 is -100.00% vs 17,700.00% in Dec 2025

QoQ Growth in quarter ended Mar 2026 is 140.00% vs -211.11% in Dec 2025
Half Yearly Results Snapshot (Standalone) - Sep'25
Growth in half year ended Sep 2025 is -39.16% vs 17.48% in Sep 2024
Growth in half year ended Sep 2025 is -70.59% vs 183.33% in Sep 2024
Nine Monthly Results Snapshot (Standalone) - Dec'25
YoY Growth in nine months ended Dec 2025 is -29.38% vs 10.86% in Dec 2024
YoY Growth in nine months ended Dec 2025 is -109.09% vs 400.00% in Dec 2024
Annual Results Snapshot (Standalone) - Mar'26
YoY Growth in year ended Mar 2026 is -36.77% vs 23.81% in Mar 2025
YoY Growth in year ended Mar 2026 is -102.00% vs 233.33% in Mar 2025
About Enterprise International Ltd

Company Coordinates


