
Compare Enviro Infra with Similar Stocks
Stock DNA
Other Utilities
INR 3,141 Cr (Small Cap)
16.00
37
0.00%
0.02
15.38%
2.58
Total Returns (Price + Dividend) 
Enviro Infra for the last several years.
Risk Adjusted Returns v/s
Returns Beta

News

Enviro Infra Engineers Ltd is Rated Sell
Enviro Infra Engineers Ltd is rated 'Sell' by MarketsMOJO, with this rating last updated on 01 June 2026. However, the analysis below reflects the stock’s current position as of 02 June 2026, incorporating the latest fundamentals, returns, and financial metrics to provide investors with an up-to-date perspective.
Read full news article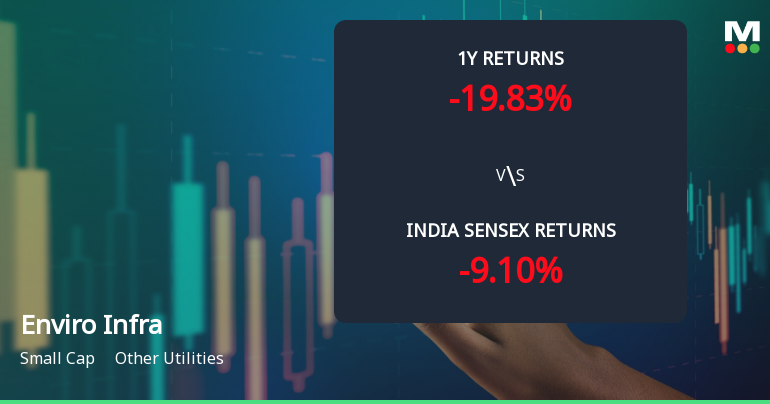
Enviro Infra Engineers Ltd Faces Technical Momentum Shift Amid Bearish Signals
Enviro Infra Engineers Ltd has experienced a notable shift in its technical momentum, moving from a mildly bullish to a mildly bearish trend. This change is underscored by mixed signals from key technical indicators such as MACD, RSI, and moving averages, reflecting growing caution among investors in the Other Utilities sector.
Read full news article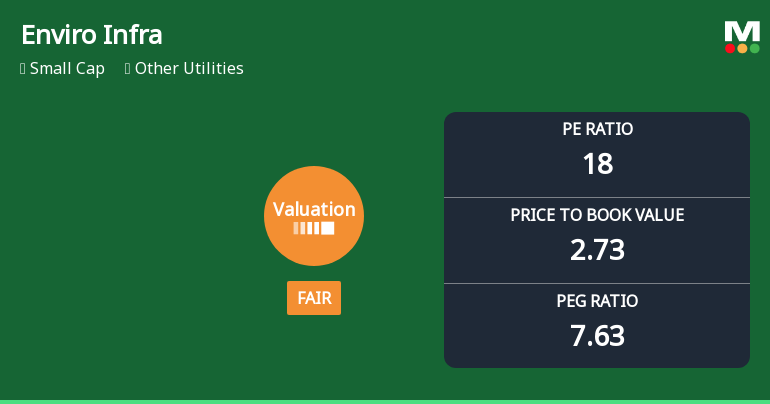
Enviro Infra Engineers Ltd Valuation Shifts Signal Renewed Price Attractiveness
Enviro Infra Engineers Ltd has witnessed a notable shift in its valuation parameters, moving from an expensive to a fair valuation grade, signalling a potential reappraisal of its price attractiveness amid a challenging market backdrop and sector dynamics.
Read full news article Announcements
Announcement under Regulation 30 (LODR)-Earnings Call Transcript
04-Jun-2026 | Source : BSETranscript of Earnings Conference Call held on May 29 2026
Announcement under Regulation 30 (LODR)-Newspaper Publication
29-May-2026 | Source : BSENewspaper Publication - Audited Financial Results for the quarter and financial year ended March 31 2026
Announcement under Regulation 30 (LODR)-Analyst / Investor Meet - Outcome
29-May-2026 | Source : BSEEarning Call Audio for the Financial Results- 31.03.2026
Corporate Actions

No Upcoming Board Meetings

No Dividend history available

No Splits history available

No Bonus history available

No Rights history available
Quality key factors
Valuation key factors
Technicals key factors
 Technical Indicator Scale: Bearish, Mildly Bearish, Sideways, Mildly Bullish, Bullish Turned
 Shareholding Snapshot : Mar 2026
Shareholding Compare (%holding)
Promoters
None
Held by 5 Schemes (0.09%)
Held by 16 FIIs (0.58%)
Sanjay Jain (27.88%)
None
24.73%
Quarterly Results Snapshot (Consolidated) - Mar'26 - QoQ

QoQ Growth in quarter ended Mar 2026 is 70.91% vs 9.97% in Dec 2025
QoQ Growth in quarter ended Mar 2026 is 28.48% vs -17.06% in Dec 2025
Half Yearly Results Snapshot (Consolidated) - Sep'25

Growth in half year ended Sep 2025 is 11.98% vs 50.09% in Sep 2024
Growth in half year ended Sep 2025 is 36.54% vs 101.40% in Sep 2024
Nine Monthly Results Snapshot (Consolidated) - Dec'25
YoY Growth in nine months ended Dec 2025 is 7.91% vs 55.32% in Dec 2024
YoY Growth in nine months ended Dec 2025 is 27.13% vs 102.63% in Dec 2024
Annual Results Snapshot (Consolidated) - Mar'26
YoY Growth in year ended Mar 2026 is 7.46% vs 46.25% in Mar 2025
YoY Growth in year ended Mar 2026 is 3.77% vs 62.59% in Mar 2025
About Enviro Infra Engineers Ltd

Company Coordinates


