Envista Holdings Corp.

  • Market Cap: Small Cap
  • Industry: Pharmaceuticals & Biotechnology
  • ISIN: US29415F1049
USD
23.84
4.82 (25.34%)
  • Price Points
  • Score
  • Mojo Parameters
  • Total Return
  • News and Corporate Actions
  • Key factors
  • Shareholding
  • Financials
  • CompanyCV
stock-summaryPrice Point
High/Low

1Day

52 Week

Valuation
Technical
Day's Volume

CASH

448.2 k

Shareholding (Sep 2025)

FII

16.34%

Held by 150 FIIs

DII

10.63%

Held by 95 DIIs

Promoter

1.29%

How big is Envista Holdings Corp.?

22-Jun-2025

As of Jun 18, Envista Holdings Corp. has a market capitalization of 3,123.65 million, with net sales of 2,503.90 million and a net profit of -1,124.20 million over the latest four quarters. Shareholder's funds are 2,934.80 million, and total assets amount to 5,450.70 million.

As of Jun 18, Envista Holdings Corp. has a market capitalization of 3,123.65 million, categorizing it as a Small Cap company.<BR><BR>As of Jun 18, the sum of net sales for the latest four quarters is 2,503.90 million, while the sum of net profit for the same period is -1,124.20 million.<BR><BR>As of Dec 24, the reporting period shows shareholder's funds of 2,934.80 million and total assets amounting to 5,450.70 million.

View full answer

What does Envista Holdings Corp. do?

22-Jun-2025

Envista Holdings Corporation is a small-cap dental products company in the Pharmaceuticals & Biotechnology industry, with net sales of $617 million and a market cap of approximately $3.12 billion as of March 2025. Key financial metrics include a P/E ratio of 73.00 and a return on equity of 1.44%.

Overview: <BR>Envista Holdings Corporation is a dental products company operating in the Pharmaceuticals & Biotechnology industry, categorized as a small-cap entity.<BR><BR>Financial Snapshot: <BR>Net Sales: 617 Million (Quarterly Results - Mar 2025) <BR>Net Profit: 18 Million (Quarterly Results - Mar 2025) <BR>Market cap: USD 3,123.65 Million (Small Cap)<BR><BR>Key Metrics: <BR>P/E: 73.00 <BR>Dividend Yield: 0.00% <BR>Debt Equity: 0.12 <BR>Return on Equity: 1.44% <BR>Price to Book: 1.03<BR><BR>Contact Details: <BR>Address: 200 S Kraemer Blvd Bldg E, BREA CA: 92821-6208 <BR>Tel: ['1 714 5167774', '1 714 8177000'] <BR>Fax: 1 302 6555049 <BR>Website: http://www.envistaco.com/

View full answer

Who are in the management team of Envista Holdings Corp.?

22-Jun-2025

As of March 2022, the management team of Envista Holdings Corp. includes Mr. Scott Huennekens (Independent Chairman), Mr. Amir Aghdaei (CEO), and several independent directors: Mr. Daniel Raskas, Ms. Wendy Carruthers, Mr. Kieran Gallahue, Mr. Vivek Jain, and Ms. Gayle Sheppard. This team provides governance and strategic direction for the company.

As of March 2022, the management team of Envista Holdings Corp. includes the following individuals:<BR><BR>- Mr. Scott Huennekens, Independent Chairman of the Board<BR>- Mr. Amir Aghdaei, President, Chief Executive Officer, and Director<BR>- Mr. Daniel Raskas, Director<BR>- Ms. Wendy Carruthers, Independent Director<BR>- Mr. Kieran Gallahue, Independent Director<BR>- Mr. Vivek Jain, Independent Director<BR>- Ms. Gayle Sheppard, Independent Director<BR><BR>This team comprises a mix of executive leadership and independent directors, contributing to the governance and strategic direction of the company.

View full answer

Is Envista Holdings Corp. overvalued or undervalued?

20-Sep-2025

As of August 7, 2025, Envista Holdings Corp. is considered undervalued with a favorable valuation grade shift, despite its recent stock performance lagging behind the S&P 500, showing a year-to-date return of 9.02% compared to the index's 12.22%.

As of 7 August 2025, the valuation grade for Envista Holdings Corp. has moved from expensive to attractive, indicating a shift towards a more favorable assessment. The company is currently considered undervalued, supported by a P/E ratio of 73, an EV to EBITDA of 13.83, and a Price to Book Value of 1.05. In comparison to peers, QIAGEN NV has a P/E of 24.20, while Masimo Corp. shows a significantly higher P/E of 179.74, reinforcing Envista's relative attractiveness.<BR><BR>Despite the positive valuation outlook, Envista's recent stock performance has lagged behind the S&P 500, with a year-to-date return of 9.02% compared to the index's 12.22%. Over the past three years, the stock has declined by 38.69%, while the S&P 500 has gained 70.41%, highlighting the need for cautious optimism regarding its future performance.

View full answer

Is Envista Holdings Corp. technically bullish or bearish?

20-Sep-2025

As of September 12, 2025, Envista Holdings Corp. has a mildly bullish technical trend, supported by positive MACD and Bollinger Bands, but caution is advised due to a mildly bearish OBV and underperformance compared to the S&P 500.

As of 12 September 2025, the technical trend for Envista Holdings Corp. has changed from bullish to mildly bullish. The weekly MACD is bullish, while the monthly MACD is mildly bullish, indicating some positive momentum. The Bollinger Bands also reflect a bullish stance on the weekly and mildly bullish on the monthly. Daily moving averages are bullish, supporting the overall mildly bullish outlook. However, the OBV shows a mildly bearish trend on the monthly, which could signal some caution.<BR><BR>In terms of performance, Envista has underperformed the S&P 500 over the past week and year, with returns of -2.68% and 9.65% respectively, compared to the S&P 500's returns of 1.05% and 17.14%. Overall, the current technical stance is mildly bullish, but the mixed signals suggest a need for careful monitoring.

View full answer
iScoreScore
Click here to find our call on this stock
Strong Sell
Sell
Hold
Buy
Strong Buy

MarketsMojo — Loved in India, Now Global

The power of Mojo is now in 29 countries. Explore global equities with the same cutting-edge features you love.

Dashboard

1

Poor Management Efficiency with a low ROCE of 6.67%

  • The company has been able to generate a Return on Capital Employed (avg) of 6.67% signifying low profitability per unit of total capital (equity and debt)
2

Company's ability to service its debt is strong with a healthy EBIT to Interest (avg) ratio of 5.77

 
3

Poor long term growth as Net Sales has grown by an annual rate of 2.21% over the last 5 years

 
4

Negative results in Jun 25

5

With ROCE of 4.03%, it has a risky valuation with a 1.04 Enterprise value to Capital Employed

stock-summaryMojo Parameters

Mojo Parameters

Stock DNA

stock-summary
Industry

Pharmaceuticals & Biotechnology

stock-summary
Market cap

USD 4,056 Million (Small Cap)
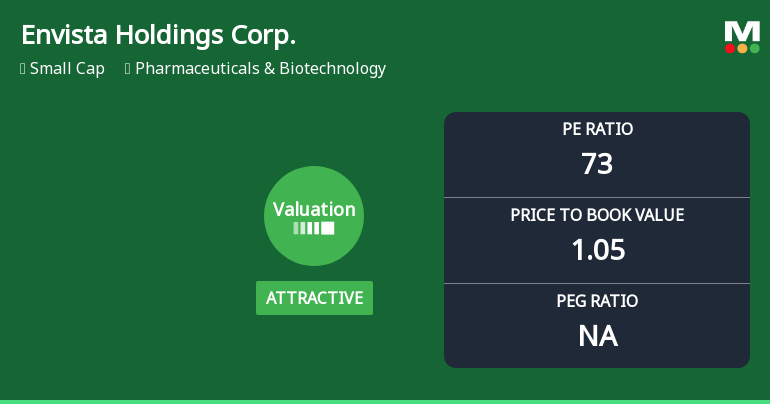
stock-summary
P/E

73.00

stock-summary
Industry P/E

NA

stock-summary
Dividend Yield

0.00%

stock-summary
Debt Equity

0.11

stock-summary
Return on Equity

1.05%

stock-summary
Price to Book

1.31

Revenue and Profits:
Net Sales:
682 Million
(Quarterly Results - Jun 2025)
Net Profit:
26 Million
stock-summaryTotal Returns
Total Returns (Price + Dividend) stock-summary
TimePeriod
Price Return
Dividend Return
Total Return
3 Months
36.15%
0%
36.15%
6 Months
19.26%
0%
19.26%
1 Year
31.21%
0%
31.21%
2 Years
-25.01%
0%
-25.01%
3 Years
-40.7%
0%
-40.7%
4 Years
-45.32%
0%
-45.32%
5 Years
11.72%
0%
11.72%

Envista Holdings Corp. for the last several years.

Risk Adjusted Returns v/s stock-summary
stock-summaryKey Factors

Quality key factors stock-summary

Factor
Value
Sales Growth (5y)
2.21%
EBIT Growth (5y)
9.80%
EBIT to Interest (avg)
5.77
Debt to EBITDA (avg)
1.35
Net Debt to Equity (avg)
0.12
Sales to Capital Employed (avg)
0.52
Tax Ratio
3.04%
Dividend Payout Ratio
0
Pledged Shares
0
Institutional Holding
100.00%
ROCE (avg)
6.67%
ROE (avg)
5.51%

Valuation key factors

Factor
Value
P/E Ratio
73
Industry P/E
Price to Book Value
1.05
EV to EBIT
25.79
EV to EBITDA
13.83
EV to Capital Employed
1.04
EV to Sales
1.42
PEG Ratio
NA
Dividend Yield
NA
ROCE (Latest)
4.03%
ROE (Latest)
1.44%

Technicals key factors

Indicator
Weekly
Monthly
MACD
Bullish
Mildly Bullish
RSI
No Signal
No Signal
Bollinger Bands
Mildly Bullish
Bullish
Moving Averages
Bullish (Daily)
KST
Bullish
Mildly Bullish
Dow Theory
No Trend
Mildly Bullish
OBV
Mildly Bullish
Mildly Bullish
stock-summary Technical Indicator Scale: Bearish, Mildly Bearish, Sideways, Mildly Bullish, Bullish  Turned 
stock-summaryShareholding
Shareholding Snapshot : Sep 2025stock-summary
Shareholding Compare (%holding) stock-summary
Majority shareholders

Domestic Funds

Domestic Funds

Held in 94 Schemes (71.72%)

Foreign Institutions

Held by 150 Foreign Institutions (16.34%)

Strategic Entities with highest holding

Highest Public shareholder

stock-summaryFinancial
[
  {
    "link": "quarterly",
    "btn_text": "All Quarterly Results",
    "header": "Quarterly Results Snapshot (Consolidated) - Jun'25 - QoQ",
    "rhs": [
      {
        "prefix": "Net Sales ",
        "suffix": "QoQ Growth in quarter ended Jun 2025 is 10.57% vs -5.51% in Mar 2025",
        "dir": 1
      },
      {
        "prefix": "Consolidated Net Profit ",
        "suffix": "QoQ Growth in quarter ended Jun 2025 is 46.67% vs 1,400.00% in Mar 2025",
        "dir": -1
      }
    ],
    "table": {
      "header": [
        "Jun'25",
        "Mar'25",
        "Change(%)"
      ],
      "body": [
        {
          "field": "Net Sales",
          "val1": "682.10",
          "val2": "616.90",
          "chgp": "10.57%",
          "chgp_class": "positive"
        },
        {
          "field": "Operating Profit (PBDIT) excl Other Income",
          "val1": "80.60",
          "val2": "77.20",
          "chgp": "4.40%",
          "chgp_class": "positive"
        },
        {
          "field": "Interest",
          "val1": "8.00",
          "val2": "9.30",
          "chgp": "-13.98%",
          "chgp_class": "positive"
        },
        {
          "field": "Exceptional Items",
          "val1": "-4.50",
          "val2": "-10.30",
          "chgp": "56.31%",
          "chgp_class": "positive"
        },
        {
          "field": "Consolidate Net Profit",
          "val1": "26.40",
          "val2": "18.00",
          "chgp": "46.67%",
          "chgp_class": "positive"
        },
        {
          "field": "Operating Profit Margin (Excl OI)",
          "val1": "74.50%",
          "val2": "79.90%",
          "chgp": "-0.54%",
          "chgp_class": "negative"
        }
      ]
    }
  },
  {
    "link": "annual",
    "btn_text": "All Annual Results",
    "header": "Annual Results Snapshot (Consolidated) - Dec'24",
    "rhs": [
      {
        "prefix": "Net Sales ",
        "suffix": "YoY Growth in year ended Dec 2024 is -2.18% vs -0.10% in Dec 2023",
        "dir": -1
      },
      {
        "prefix": "Consolidated Net Profit ",
        "suffix": "YoY Growth in year ended Dec 2024 is -1,016.37% vs -142.10% in Dec 2023",
        "dir": -1
      }
    ],
    "table": {
      "header": [
        "Dec'24",
        "Dec'23",
        "Change(%)"
      ],
      "body": [
        {
          "field": "Net Sales",
          "val1": "2,510.60",
          "val2": "2,566.50",
          "chgp": "-2.18%",
          "chgp_class": "negative"
        },
        {
          "field": "Operating Profit (PBDIT) excl Other Income",
          "val1": "266.20",
          "val2": "487.50",
          "chgp": "-45.39%",
          "chgp_class": "negative"
        },
        {
          "field": "Interest",
          "val1": "46.40",
          "val2": "63.40",
          "chgp": "-26.81%",
          "chgp_class": "positive"
        },
        {
          "field": "Exceptional Items",
          "val1": "-1,181.30",
          "val2": "-321.90",
          "chgp": "-266.98%",
          "chgp_class": "negative"
        },
        {
          "field": "Consolidate Net Profit",
          "val1": "-1,118.60",
          "val2": "-100.20",
          "chgp": "-1,016.37%",
          "chgp_class": "negative"
        },
        {
          "field": "Operating Profit Margin (Excl OI)",
          "val1": "57.00%",
          "val2": "126.60%",
          "chgp": "-6.96%",
          "chgp_class": "negative"
        }
      ]
    }
  }
]

Quarterly Results Snapshot (Consolidated) - Jun'25 - QoQstock-summary

Jun'25
Mar'25
Change(%)
Net Sales
682.10
616.90
10.57%
Operating Profit (PBDIT) excl Other Income
80.60
77.20
4.40%
Interest
8.00
9.30
-13.98%
Exceptional Items
-4.50
-10.30
56.31%
Consolidate Net Profit
26.40
18.00
46.67%
Operating Profit Margin (Excl OI)
74.50%
79.90%
-0.54%
USD in Million.
Direction Arrows
Net Sales

QoQ Growth in quarter ended Jun 2025 is 10.57% vs -5.51% in Mar 2025

Direction Arrows
Consolidated Net Profit

QoQ Growth in quarter ended Jun 2025 is 46.67% vs 1,400.00% in Mar 2025

Annual Results Snapshot (Consolidated) - Dec'24stock-summary

Dec'24
Dec'23
Change(%)
Net Sales
2,510.60
2,566.50
-2.18%
Operating Profit (PBDIT) excl Other Income
266.20
487.50
-45.39%
Interest
46.40
63.40
-26.81%
Exceptional Items
-1,181.30
-321.90
-266.98%
Consolidate Net Profit
-1,118.60
-100.20
-1,016.37%
Operating Profit Margin (Excl OI)
57.00%
126.60%
-6.96%
USD in Million.
Direction Arrows
Net Sales

YoY Growth in year ended Dec 2024 is -2.18% vs -0.10% in Dec 2023

Direction Arrows
Consolidated Net Profit

YoY Growth in year ended Dec 2024 is -1,016.37% vs -142.10% in Dec 2023

stock-summaryCompany CV
About Envista Holdings Corp. stock-summary
stock-summary
Envista Holdings Corp.
Pharmaceuticals & Biotechnology
Envista Holdings Corporation is a dental products company. The Company provides products that are used to diagnose, treat and prevent disease and ailments of the teeth, gums and supporting bone. The Company operates through two segments: Specialty Products & Technologies, and Equipment & Consumables. Its Specialty Products & Technologies segment develops, manufactures and markets dental implant systems, dental prosthetics and associated treatment software and technologies, as well as orthodontic bracket systems, aligners and lab products. Its Equipment & Consumables segment develops, manufactures and markets dental equipment and supplies used in dental offices, including digital imaging systems, software and other visualization/magnification systems; treatment units and other dental practice equipment; endodontic systems and related consumables; restorative materials and instruments, rotary burs, impression materials, bonding agents and cements and infection prevention products.
Company Coordinates stock-summary
Company Details
200 S Kraemer Blvd Bldg E , BREA CA : 92821-6208
stock-summary
Tel: 1 714 51677741 714 8177000
stock-summary
Registrar Details