
Compare EPack PrefabTech with Similar Stocks
Stock DNA
Construction
INR 2,400 Cr (Small Cap)
25.00
26
0.00%
-0.26
12.59%
3.16
Total Returns (Price + Dividend) 
EPack PrefabTech for the last several years.
Risk Adjusted Returns v/s
Returns Beta

News
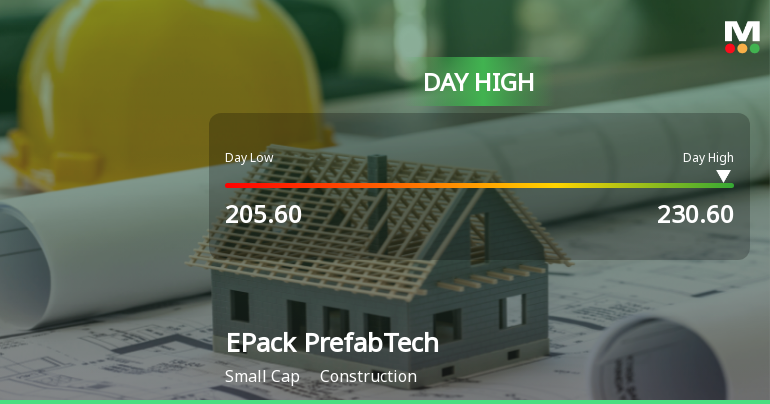
EPack Prefab Technologies Ltd Surges 9.23% to Day's High of Rs 229 — Outperforms Sector by 9.74 Percentage Points
While the Sensex struggled with a 0.25% decline, EPack Prefab Technologies Ltd surged 9.23% on 11 Jun 2026, touching an intraday high of Rs 229. This 9.74 percentage-point outperformance over its Construction sector peers highlights a distinctly stock-specific rally rather than a market-wide uplift.
Read full news article
EPack Prefab Technologies Ltd Upgraded to Buy on Improved Fundamentals and Technicals
EPack Prefab Technologies Ltd has seen its investment rating upgraded from Hold to Buy, driven by a combination of improved technical indicators, attractive valuation metrics, solid financial trends, and enhanced quality scores. The small-cap construction firm’s recent performance and outlook have prompted analysts to revise their stance, reflecting growing investor confidence amid a challenging market backdrop.
Read full news article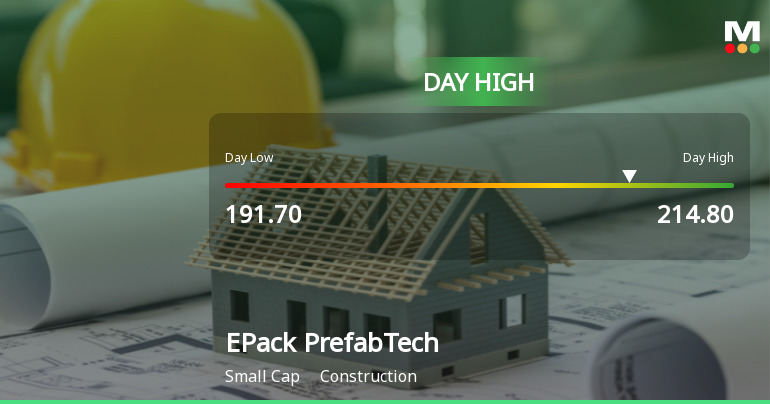
EPack Prefab Technologies Ltd Surges 12.89% Amid Mixed Market Conditions
While the Sensex declined sharply by 1.1% on 03 Jun 2026, EPack Prefab Technologies Ltd bucked the trend with a robust 12.89% gain, marking a standout session in the Construction sector. This 6.57-percentage-point outperformance over its sector peers highlights a distinctly stock-specific rally rather than a market-wide uplift.
Read full news article Announcements
Receipt Of Material Purchase Order Under Para C Of Part A Of Schedule III Of SEBI (Listing Obligations And Disclosure Requirements) 2015
02-Jun-2026 | Source : BSEWe wish to inform you regarding receipt of a Material Purchase order under Para C of Part A of Schedule III of SEBI (Listing Obligations and Disclosure Requirements) 2015
Announcement under Regulation 30 (LODR)-Cessation
30-May-2026 | Source : BSEIntimation of Resignation of SMP as per Regulation 30 of SEBI (Listing obligations and disclosure requirements) 2015
Compliances-Reg.24(A)-Annual Secretarial Compliance
30-May-2026 | Source : BSESubmission of Annual Secretarial Compliance Report for Financial year ended on March 31 2026
Corporate Actions

No Upcoming Board Meetings

No Dividend history available

No Splits history available

No Bonus history available

No Rights history available
Quality key factors
Valuation key factors
Technicals key factors
 Technical Indicator Scale: Bearish, Mildly Bearish, Sideways, Mildly Bullish, Bullish Turned
 Shareholding Snapshot : Mar 2026
Shareholding Compare (%holding)
Promoters
None
Held by 1 Schemes (1.55%)
Held by 9 FIIs (10.91%)
Pinky Ajay Singhania (6.5%)
South Asia Growth Fund Iii Holdings, Llc (10.23%)
16.59%
Quarterly Results Snapshot (Standalone) - Mar'26 - QoQ

QoQ Growth in quarter ended Mar 2026 is 44.75% vs -25.05% in Dec 2025
QoQ Growth in quarter ended Mar 2026 is 79.98% vs -42.83% in Dec 2025
Half Yearly Results Snapshot (Standalone) - Sep'25
Not Applicable: The company has declared_date for only one period
Not Applicable: The company has declared_date for only one period
Nine Monthly Results Snapshot (Standalone) - Dec'25
Not Applicable: The company has declared_date for only one period
Not Applicable: The company has declared_date for only one period
Annual Results Snapshot (Standalone) - Mar'26
YoY Growth in year ended Mar 2026 is 34.52% vs 25.07% in Mar 2025
YoY Growth in year ended Mar 2026 is 56.42% vs 33.59% in Mar 2025
About EPack Prefab Technologies Ltd

Company Coordinates


