
Compare EPL Ltd with Similar Stocks
Dashboard
Strong ability to service debt as the company has a low Debt to EBITDA ratio of 1.00 times
Poor long term growth as Net Sales has grown by an annual rate of 9.03% and Operating profit at 9.05% over the last 5 years
Flat results in Mar 26
With ROCE of 16.1, it has a Very Attractive valuation with a 2.1 Enterprise value to Capital Employed
High Institutional Holdings at 27.42%
Stock DNA
Packaging
INR 7,206 Cr (Small Cap)
17.00
35
2.30%
0.26
14.44%
2.44
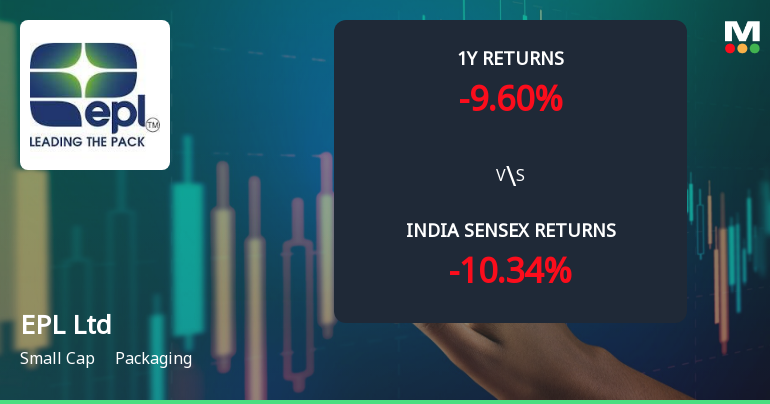
Total Returns (Price + Dividend) 
Latest dividend: 2.5 per share ex-dividend date: Nov-17-2025
Risk Adjusted Returns v/s
Returns Beta

News
EPL Ltd Technical Momentum Shifts Amid Mixed Market Signals
EPL Ltd, a small-cap player in the packaging sector, has recently exhibited a subtle shift in price momentum, moving from a sideways trend to a mildly bullish stance. Despite a 4.03% gain on the day to ₹216.95, technical indicators present a nuanced picture, with some signals suggesting caution while others hint at potential upside. This article analyses the latest technical parameters, comparing them with broader market trends and historical performance to provide a comprehensive view for investors.
Read full news article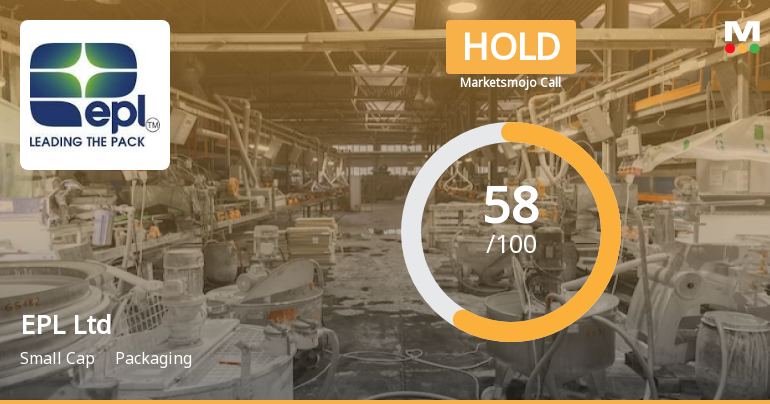
EPL Ltd is Rated Hold by MarketsMOJO
EPL Ltd is rated 'Hold' by MarketsMOJO, with this rating last updated on 16 May 2026. However, the analysis and financial metrics discussed here reflect the stock's current position as of 09 June 2026, providing investors with the most up-to-date view of the company’s fundamentals, returns, and market standing.
Read full news article
EPL Ltd Technical Momentum Shifts Amid Market Pressure
EPL Ltd, a small-cap player in the packaging sector, has experienced a notable shift in its technical momentum, moving from a mildly bullish stance to a sideways trend. Despite a recent downgrade from a Buy to a Hold rating by MarketsMOJO on 16 May 2026, the stock continues to exhibit mixed signals across key technical indicators, reflecting a cautious outlook for investors amid broader market pressures.
Read full news article Announcements
Certificate Confirming Fulfilment Of Payment Obligations Of Commercial Papers Issued By EPL Limited
01-Jun-2026 | Source : BSECertificate confirming fulfilment of payment obligations of Commercial Papers issued by EPL Limited on March 2 2026 with a maturity date of June 1 2026 is enclosed herewith.
Receipt Of Approval From The Competition Commission Of India (CCI)
27-May-2026 | Source : BSEIntimation regarding receipt of approval from the Competition Commission of India (CCI) to the Scheme of Amalgamation of Indovida India Private Limited with EPL Limited and their respective shareholders is enclosed herewith.
Compliances-Reg.24(A)-Annual Secretarial Compliance
27-May-2026 | Source : BSEAnnual Secretarial Compliance Report for the financial year ended March 31 2026 obtained from M/s. Dilip Bharadiya & Associates Company Secretaries is enclosed herewith.
Corporate Actions

No Upcoming Board Meetings

EPL Ltd has declared 125% dividend, ex-date: 17 Nov 25

EPL Ltd has announced 2:10 stock split, ex-date: 08 Jun 06

EPL Ltd has announced 1:1 bonus issue, ex-date: 20 Jun 18

No Rights history available
Quality key factors
Valuation key factors
Technicals key factors
 Technical Indicator Scale: Bearish, Mildly Bearish, Sideways, Mildly Bullish, Bullish Turned
 Shareholding Snapshot : Mar 2026
Shareholding Compare (%holding)
Non Institution
None
Held by 12 Schemes (6.98%)
Held by 172 FIIs (17.23%)
Epsilon Bidco Pte.ltd. (26.38%)
Indorama Netherlands B V (24.82%)
13.03%
Quarterly Results Snapshot (Consolidated) - Mar'26 - YoY

YoY Growth in quarter ended Mar 2026 is 17.65% vs 7.40% in Mar 2025

YoY Growth in quarter ended Mar 2026 is -9.97% vs 412.56% in Mar 2025
Half Yearly Results Snapshot (Consolidated) - Sep'25
Growth in half year ended Sep 2025 is 10.52% vs 9.51% in Sep 2024
Growth in half year ended Sep 2025 is 35.12% vs 44.27% in Sep 2024
Nine Monthly Results Snapshot (Consolidated) - Dec'25
YoY Growth in nine months ended Dec 2025 is 11.41% vs 7.66% in Dec 2024
YoY Growth in nine months ended Dec 2025 is 16.88% vs 28.18% in Dec 2024
Annual Results Snapshot (Consolidated) - Mar'26
YoY Growth in year ended Mar 2026 is 13.05% vs 7.59% in Mar 2025
YoY Growth in year ended Mar 2026 is 8.33% vs 68.39% in Mar 2025
About EPL Ltd

Company Coordinates


