
Compare Epuja Spiritech with Similar Stocks
Dashboard
With a Operating Losses, the company has a Weak Long Term Fundamental Strength
- Poor long term growth as Net Sales has grown by an annual rate of -17.36% and Operating profit at -257.10%
The company has declared Negative results for the last 3 consecutive quarters
Risky - Negative EBITDA
Below par performance in long term as well as near term
Stock DNA
Non Banking Financial Company (NBFC)
INR 15 Cr (Micro Cap)
NA (Loss Making)
21
0.00%
0.00
-41.31%
0.58
Total Returns (Price + Dividend) 
Latest dividend: 0.02 per share ex-dividend date: Sep-20-2019
Risk Adjusted Returns v/s
Returns Beta

News

Epuja Spiritech Ltd Falls to 52-Week Low of Rs 1.22 as Sell-Off Deepens
For the fifth consecutive session, Epuja Spiritech Ltd closed lower, hitting a fresh 52-week low of Rs 1.22 on 17 Jun 2026, extending a steep decline that has seen the stock lose nearly two-thirds of its value over the past year.
Read full news article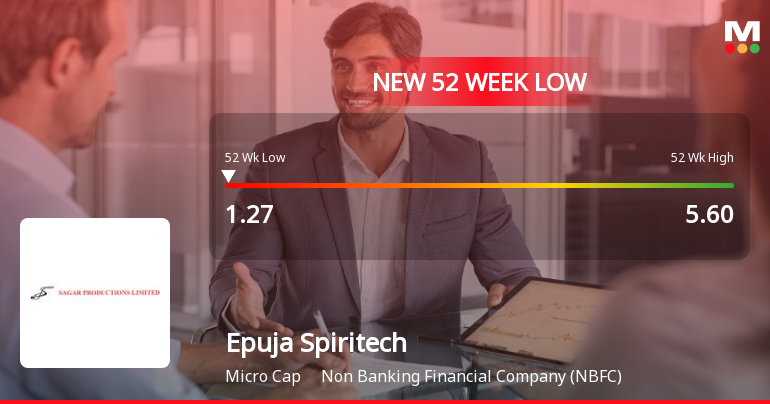
Epuja Spiritech Ltd Falls to 52-Week Low of Rs 1.27 as Sell-Off Deepens
A sharp decline of 3.01% today dragged Epuja Spiritech Ltd to a fresh 52-week low of Rs 1.27, extending a downward trend that has seen the stock lose nearly 68% over the past year despite a broadly rising market.
Read full news article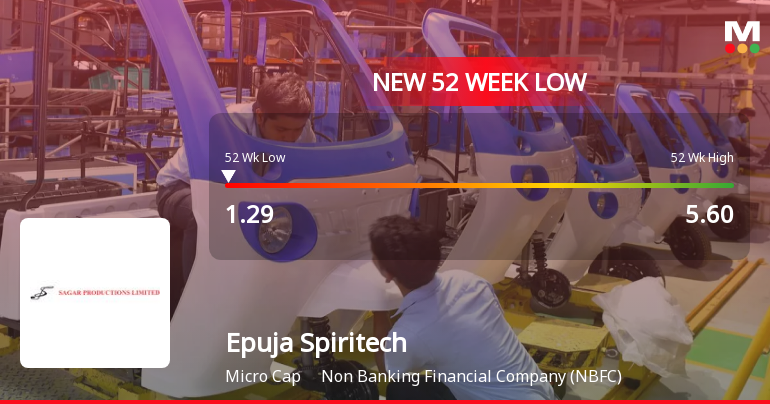
Announcements
Compliances-Reg.24(A)-Annual Secretarial Compliance
28-May-2026 | Source : BSEAnnual Secretarial Compliance Report for the year ended 31st March 2026.
Announcement under Regulation 30 (LODR)-Newspaper Publication
12-May-2026 | Source : BSENewspaper publication of financial results for quarter ended on 31st march2026.
To Consider And Approve Audited Fiancial Statements For The Quarter Ended 31St March 2026
08-May-2026 | Source : BSEto consider and approve standalone and consolidated financial statements for the quarter ended 31st March 2026 as per SEBI(LODR) reg along with the statutory report given by auditor of the company.
Corporate Actions

No Upcoming Board Meetings

Epuja Spiritech Ltd has declared 2% dividend, ex-date: 20 Sep 19

No Splits history available

No Bonus history available

No Rights history available
Quality key factors
Valuation key factors
Technicals key factors
 Technical Indicator Scale: Bearish, Mildly Bearish, Sideways, Mildly Bullish, Bullish Turned
 Shareholding Snapshot : Mar 2026
Shareholding Compare (%holding)
Non Institution
None
Held by 0 Schemes
Held by 2 FIIs (0.38%)
Winfotel Infomedia Technologies Pvt Ltd (7.96%)
Shiva Kumar (6.21%)
76.92%
Quarterly Results Snapshot (Standalone) - Mar'26 - YoY

YoY Growth in quarter ended Mar 2026 is -77.52% vs 3,095.45% in Mar 2025
YoY Growth in quarter ended Mar 2026 is -603.45% vs 397.44% in Mar 2025
Half Yearly Results Snapshot (Standalone) - Sep'25
Growth in half year ended Sep 2025 is -62.90% vs 40.91% in Sep 2024

Growth in half year ended Sep 2025 is -190.63% vs -481.82% in Sep 2024
Nine Monthly Results Snapshot (Standalone) - Dec'25
YoY Growth in nine months ended Dec 2025 is -83.23% vs 117.57% in Dec 2024
YoY Growth in nine months ended Dec 2025 is -364.00% vs -1,011.11% in Dec 2024
Annual Results Snapshot (Standalone) - Mar'26
YoY Growth in year ended Mar 2026 is -78.50% vs 801.04% in Mar 2025
YoY Growth in year ended Mar 2026 is -6,656.25% vs 133.33% in Mar 2025
About Epuja Spiritech Ltd

Company Coordinates


