
Compare ERP Soft Systems with Similar Stocks
Dashboard
Weak Long Term Fundamental Strength with a -3.20% CAGR growth in Operating Profits over the last 5 years
- Company's ability to service its debt is weak with a poor EBIT to Interest (avg) ratio of 0.31
- The company has been able to generate a Return on Equity (avg) of 1.30% signifying low profitability per unit of shareholders funds
Flat results in Mar 26
Risky - Not traded in last 10 days
Stock DNA
Diversified Commercial Services
INR 24 Cr (Micro Cap)
132.00
NA
0.00%
0.00
0.96%
1.33
Total Returns (Price + Dividend) 
ERP Soft Systems for the last several years.
Risk Adjusted Returns v/s
Returns Beta

News

ERP Soft Systems Ltd is Rated Strong Sell
ERP Soft Systems Ltd is rated Strong Sell by MarketsMOJO. This rating was last updated on 25 Jun 2025. However, the analysis and financial metrics presented here reflect the stock’s current position as of 21 May 2026, providing investors with an up-to-date view of the company’s performance and outlook.
Read full news articleWhen is the next results date for ERP Soft Systems Ltd?
The next results date for ERP Soft Systems Ltd is scheduled for 15 May 2026....
Read full news article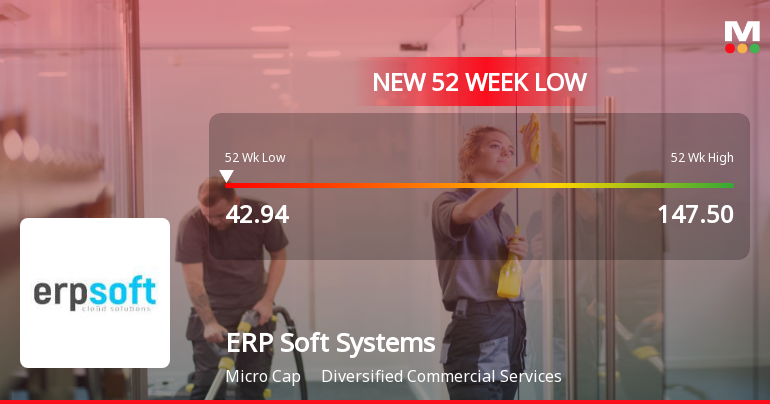
ERP Soft Systems Ltd Falls to 52-Week Low Amidst Continued Downtrend
ERP Soft Systems Ltd, a micro-cap player in the Diversified Commercial Services sector, has reached a new 52-week low of Rs.42.94, marking a significant decline amid broader market weakness and company-specific performance issues.
Read full news article Announcements
Compliances-Reg.24(A)-Annual Secretarial Compliance
30-May-2026 | Source : BSENon-Applicability of Regulation 24(A) of SEBI LODR Regulations(2015)
Audited Financial Statements For Quarter And Year Ended 31.03.2026
15-May-2026 | Source : BSEAudited Financial Statements for Quarter and Year ended 31.03.2026
Announcement under Regulation 30 (LODR)-Change in Management
15-May-2026 | Source : BSEIntimation for appointment of Internal auditor and Secretarial auditor for FY 2026-27.
Corporate Actions

No Upcoming Board Meetings

No Dividend history available

No Splits history available

No Bonus history available

No Rights history available
Quality key factors
Valuation key factors
Technicals key factors
 Technical Indicator Scale: Bearish, Mildly Bearish, Sideways, Mildly Bullish, Bullish Turned
 Shareholding Snapshot : Mar 2026
Shareholding Compare (%holding)
Promoters
None
Held by 0 Schemes
Held by 0 FIIs
Duvvuru Sreelatha (42.63%)
D Vinaya (22.72%)
44.14%
Quarterly Results Snapshot (Consolidated) - Mar'26 - YoY

YoY Growth in quarter ended Mar 2026 is -39.32% vs 30.53% in Mar 2025
YoY Growth in quarter ended Mar 2026 is -66.67% vs 300.00% in Mar 2025
Half Yearly Results Snapshot (Consolidated) - Sep'25

Growth in half year ended Sep 2025 is 29.18% vs -35.61% in Sep 2024
Growth in half year ended Sep 2025 is 80.00% vs -64.29% in Sep 2024
Nine Monthly Results Snapshot (Consolidated) - Dec'25
YoY Growth in nine months ended Dec 2025 is 18.26% vs -28.07% in Dec 2024
YoY Growth in nine months ended Dec 2025 is 44.44% vs -43.75% in Dec 2024
Annual Results Snapshot (Consolidated) - Mar'26
YoY Growth in year ended Mar 2026 is -0.72% vs -16.75% in Mar 2025
YoY Growth in year ended Mar 2026 is -5.26% vs 11.76% in Mar 2025
About ERP Soft Systems Ltd

Company Coordinates


