
Compare ESAF Small Fin with Similar Stocks
Dashboard
With a growth in Interest of 11.3%, the company declared Very Positive results in Mar 26
- The company has declared positive results for the last 2 consecutive quarters
- PAT(Q) At Rs 23.51 cr has Grown at 125.2% (vs previous 4Q average)
- PBT LESS OI(Q) Highest at Rs -174.28 cr.
- GROSS NPA(Q) Lowest at 5.41%
Market Beating Performance
Total Returns (Price + Dividend) 
Latest dividend: 0.7 per share ex-dividend date: Aug-07-2024
Risk Adjusted Returns v/s
Returns Beta

News
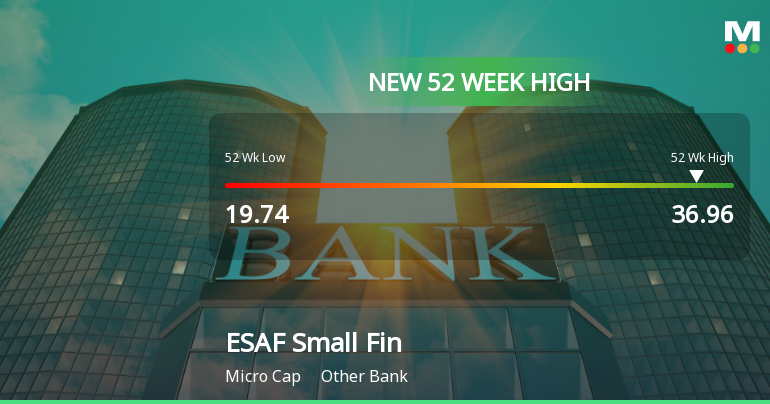
Broad-Based Technical Strength Lifts ESAF Small Finance Bank Ltd to 52-Week High of Rs 36.96
With every major moving average breached to the upside and a cluster of bullish technical indicators, ESAF Small Finance Bank Ltd surged to a new 52-week high of Rs 36.96 on 22 Jun 2026, marking a significant milestone in its price momentum journey.
Read full news article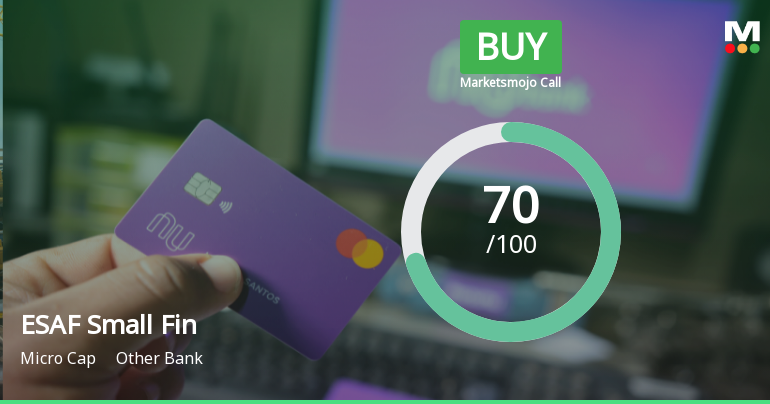
MarketsMOJO Upgrades ESAF Small Finance Bank Ltd to Buy on Strong Technical and Financial Performance
ESAF Small Finance Bank Ltd has been upgraded from a Hold to a Buy rating, reflecting significant improvements in its technical indicators and financial performance despite valuation concerns. The upgrade, effective from 19 June 2026, is driven primarily by a bullish technical trend, robust quarterly earnings growth, and market-beating returns, although challenges remain in capital adequacy and cost management.
Read full news article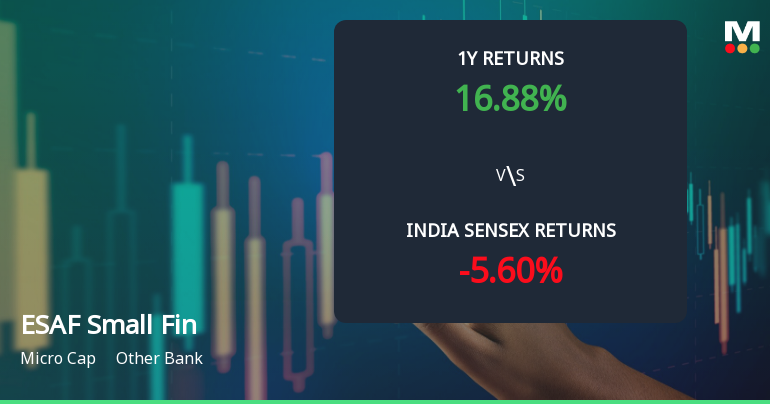
ESAF Small Finance Bank Ltd Sees Strong Technical Momentum Shift Amid Market Rally
ESAF Small Finance Bank Ltd has witnessed a significant shift in price momentum, reflected in a strong 13.48% gain on 22 Jun 2026, pushing its share price to ₹36.36, just shy of its 52-week high of ₹36.69. This surge accompanies an upgrade in its MarketsMOJO rating from Hold to Buy on 19 Jun 2026, signalling renewed investor confidence amid bullish technical indicators and improving trend dynamics.
Read full news article Announcements
Clarification sought from ESAF Small Finance Bank Ltd
17-Jun-2026 | Source : BSEThe Exchange has sought clarification from ESAF Small Finance Bank Ltd on June 17 2026 with reference to Movement in Volume.
The reply is awaited.
Announcement Under Regulation 30 Of SEBI LODR Regulations 2015 - Clarification With Respect To Volume Movement.
17-Jun-2026 | Source : BSEClarification with respect to Volume Movement.
Announcement Under Regulation 30 Of SEBI (LODR) Regulations 2015.
17-Jun-2026 | Source : BSEAnnouncement under Regulation 30 of SEBI (LODR) Regulations 2015.
Corporate Actions

No Upcoming Board Meetings

ESAF Small Finance Bank Ltd has declared 7% dividend, ex-date: 07 Aug 24

No Splits history available

No Bonus history available

No Rights history available
Quality key factors
Valuation key factors
Technicals key factors
 Technical Indicator Scale: Bearish, Mildly Bearish, Sideways, Mildly Bullish, Bullish Turned
 Shareholding Snapshot : Mar 2026
Shareholding Compare (%holding)
Promoters
None
Held by 0 Schemes
Held by 3 FIIs (0.01%)
Esaf Financial Holdings Private Limited (52.85%)
Yusuffali Musaliam Veettil Abdul Kader (4.48%)
17.54%
Quarterly Results Snapshot (Standalone) - Mar'26 - QoQ

QoQ Growth in quarter ended Mar 2026 is 11.3% vs 9.05% in Dec 2025
QoQ Growth in quarter ended Mar 2026 is 230.20% vs 106.15% in Dec 2025
Half Yearly Results Snapshot (Standalone) - Sep'25

Growth in half year ended Sep 2025 is -18.32% vs 9.53% in Sep 2024
Growth in half year ended Sep 2025 is -184.31% vs -125.66% in Sep 2024
Nine Monthly Results Snapshot (Standalone) - Dec'25
YoY Growth in nine months ended Dec 2025 is -14.28% vs 5.29% in Dec 2024
YoY Growth in nine months ended Dec 2025 is 32.22% vs -173.31% in Dec 2024
Annual Results Snapshot (Standalone) - Mar'26
YoY Growth in year ended Mar 2026 is -8.3% vs 1.02% in Mar 2025
YoY Growth in year ended Mar 2026 is 64.09% vs -208.89% in Mar 2025
About ESAF Small Finance Bank Ltd

Company Coordinates


